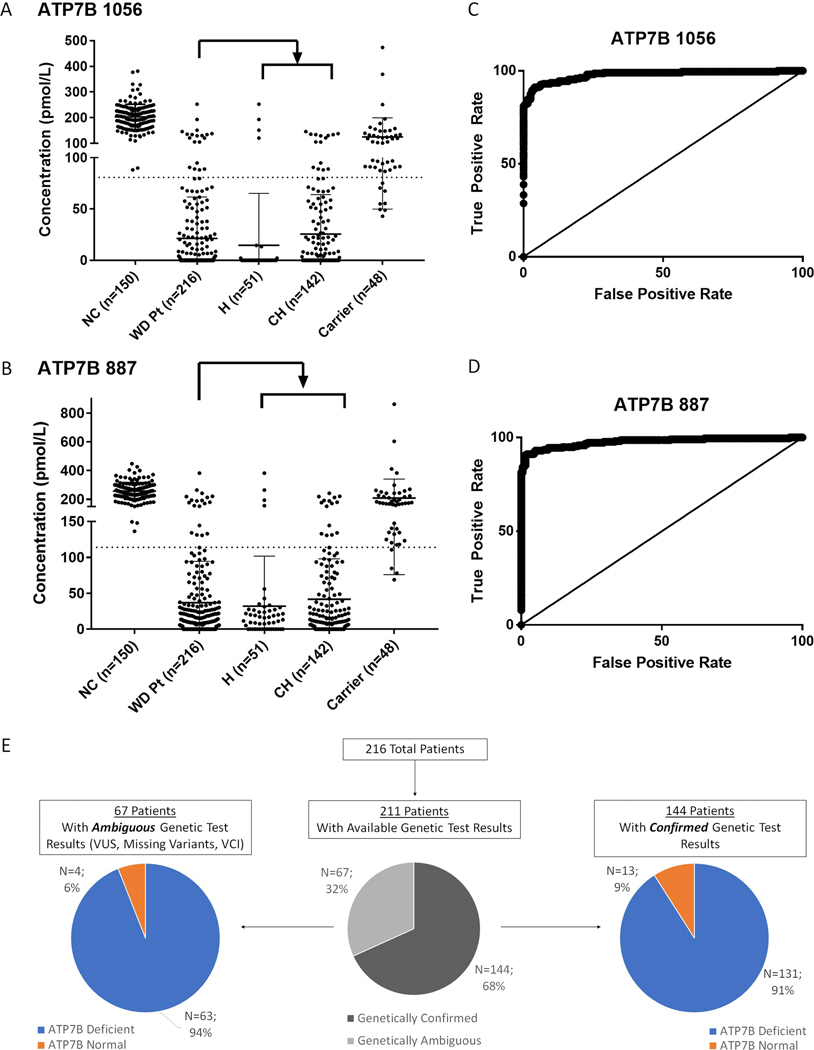
Figure 2:
Diagnostic performance of ATP7B peptide analysis. Comparison of ATP7B peptide measurements for ATP7B 1056 (A) and ATP7B 887 (B) peptides in normal control patients (NC), patients, homozygotes (H), compound heterozygotes (CH) and carriers. Dotted lines represent diagnostic cut-offs for each peptide. ROC curves show the diagnostic performance of ATP7B 1056 (C) and ATP7B 887 (D). WD patients with genetic test results are readily identified even in subgroups where genetic results are ambiguous (E).

