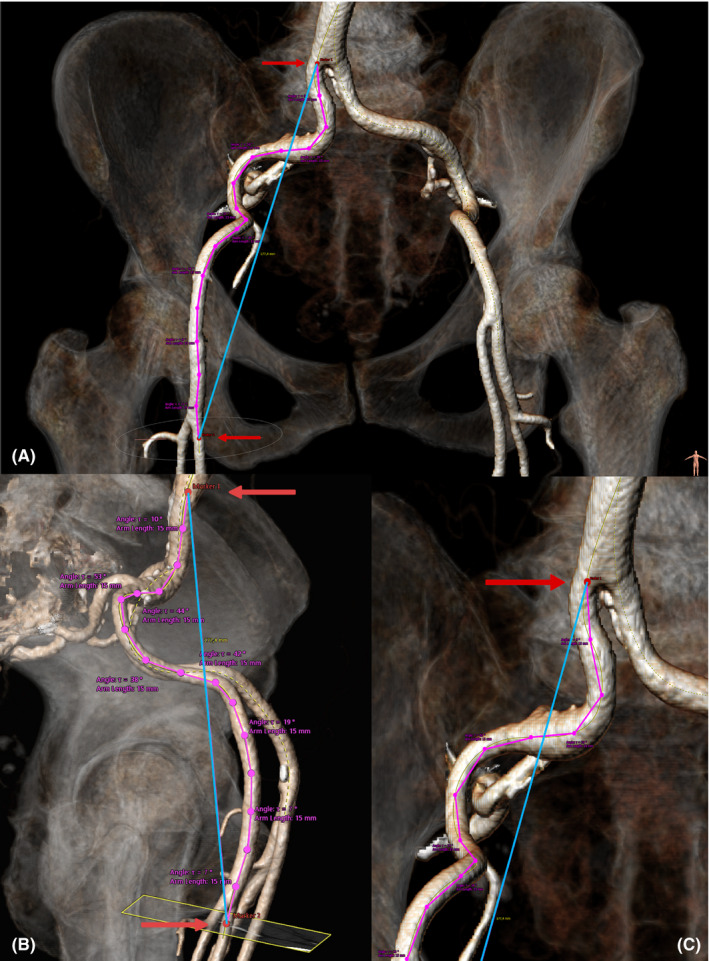
FIGURE 1.

Reconstructed three‐dimensional model of the iliofemoral vasculature based on multislice computed tomography images, viewed from the frontal (A and C) and sagittal plane (B). Superimposed markers show the vessel bifurcation points (red markers), ideal vessel length (blue line trace), true vessel length (purple line trace) and angles of the vessel at each 15‐mm interval (three‐point segments along the purple line trace) used to characterize vascular tortuosity
