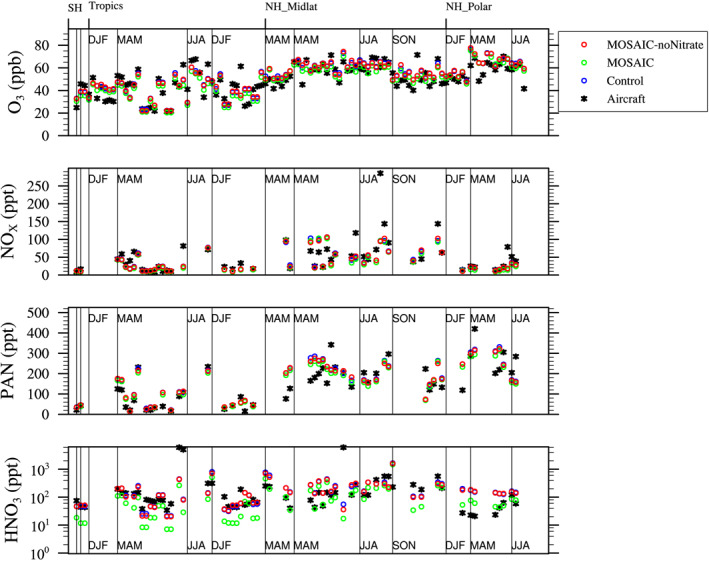
Figure 1.

Comparison of O3, NOx, PAN, and HNO3 simulated by the three model experiments against an aircraft climatology for the free troposphere for 2–7 km sorted by different regions (Southern Hemisphere [SH], Tropics, Northern Hemisphere [NH] midlatitudes, NH Polar) and the four seasons between 1995 and 2010.
