Figure 2.

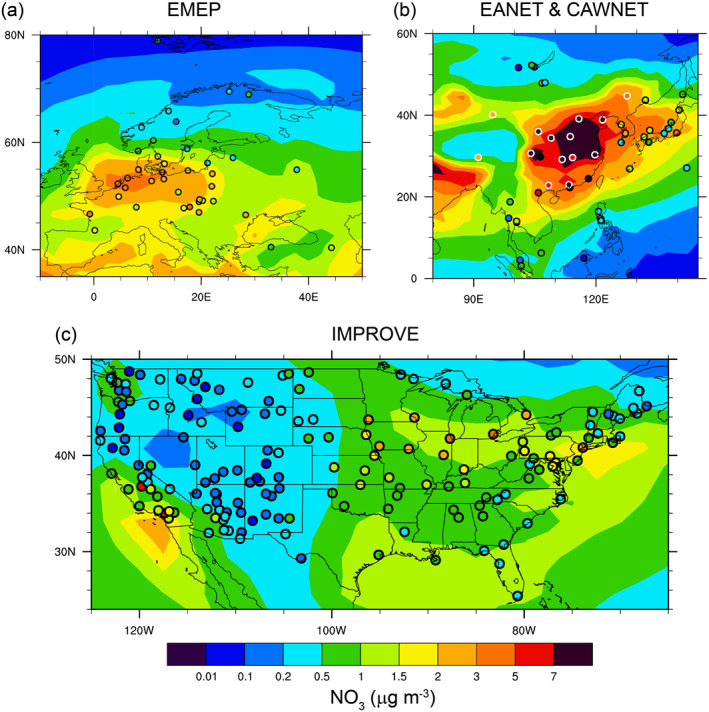
Simulated and observed (filled circles) spatial distributions of the annual mean aerosol NO3 mass concentrations for (a) EMEP network in Europe; (b) EANET and CAWNET networks in East Asia and China, respectively; and (c) IMPROVE network in the United States.
