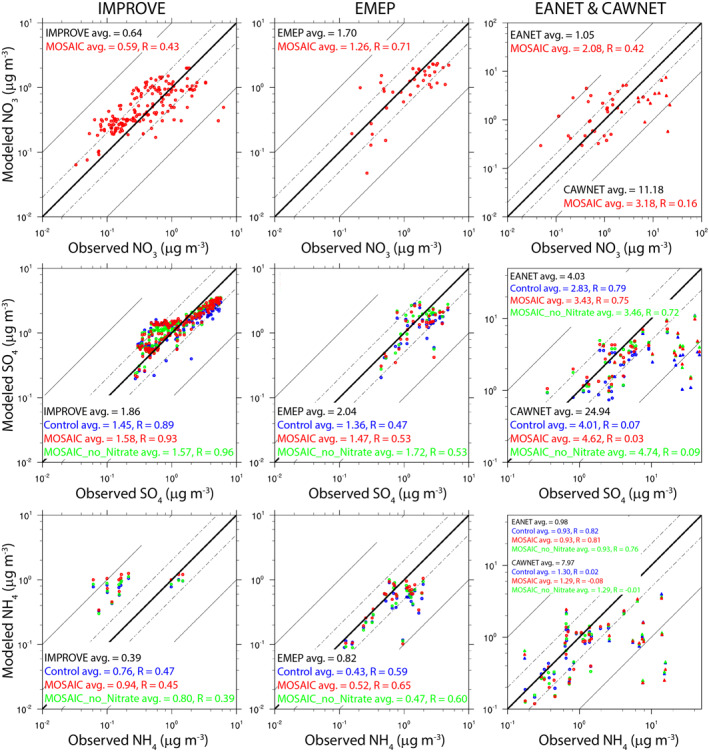
Figure 3.

Scatter plots of modeled versus observed annual mean aerosol NO3 (top row), SO4 (middle row), and NH4 (bottom row) surface mass concentrations at IMPROVE (left column), EMEP (middle column), and EANET and CAWNET (left column) network sites.
