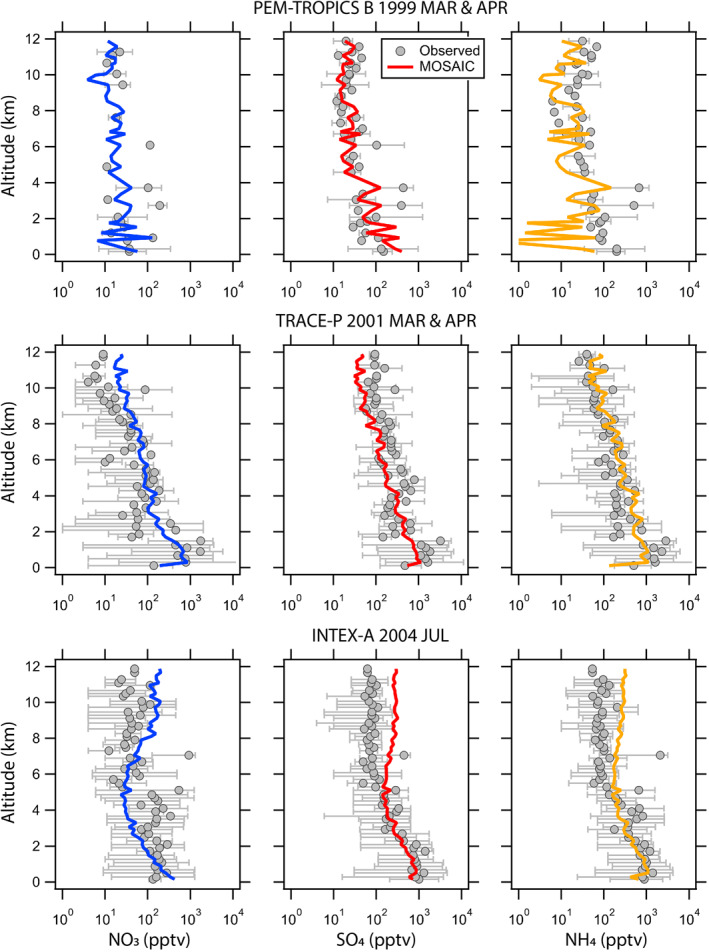
Figure 4.

Comparison of modeled (colored lines) and observed (gray circles with error bars representing the range) mean vertical profiles of aerosol NO3 (first column), SO4 (middle column), and NH4 (last column) during PEM‐TROPICS B 1999 over the tropical Pacific Ocean, TRACE‐P 2001 over the North Western Pacific Ocean, and INTEX‐A 2004 over the Eastern U.S. The model results were sampled along the aircraft flight tracks and then the mean vertical profiles were calculated.
