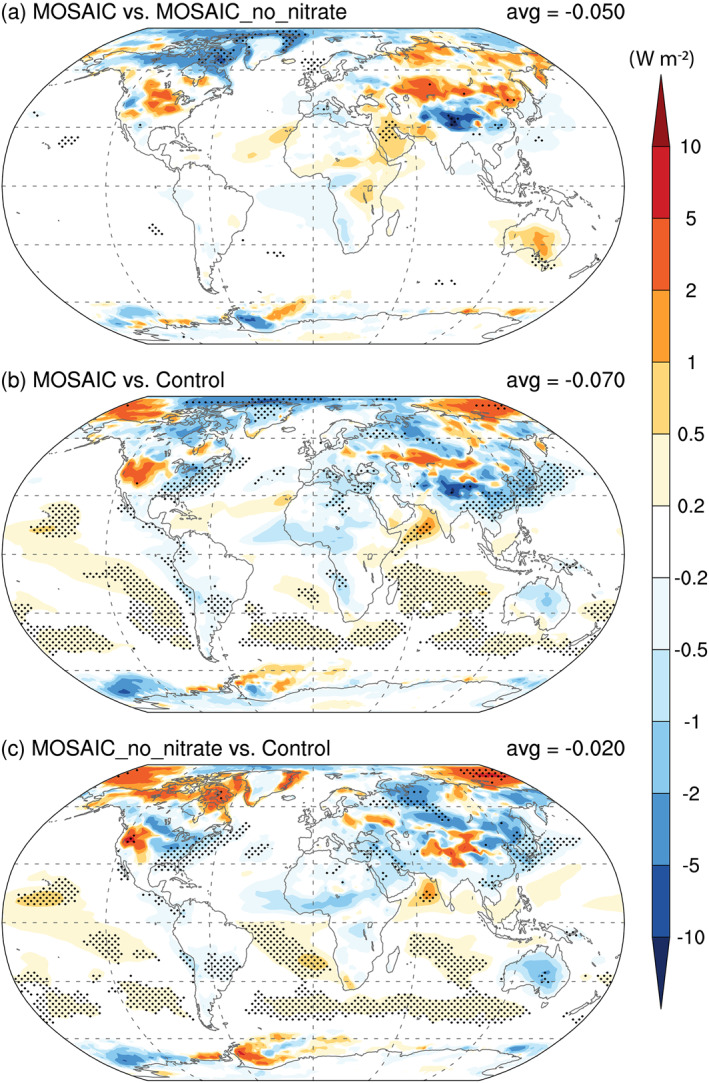
Figure 9.

Global distribution of changes in the annual mean clear‐sky shortwave fluxes at the top of the model atmosphere due to (a) including nitrate aerosol (MOSAIC vs. MOSAIC_no_nitrate), (b) all MOSAIC effects (MOSAIC vs. Control), and (c) MOSAIC effects other than nitrate aerosol (MOSAIC_no_nitrate vs. Control). Stippled areas indicate statistical significance (using t test based on the 10 individual annual means).
