
Figure 1.
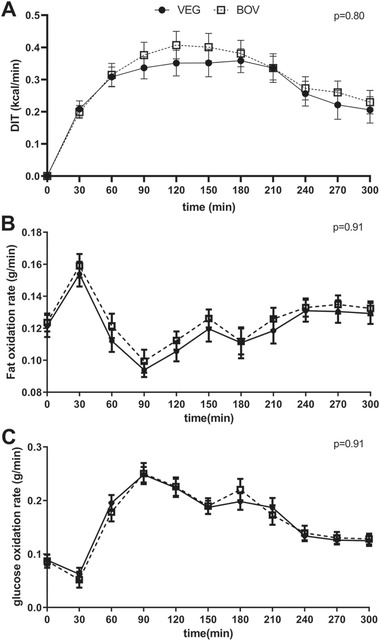
Diet‐induced thermogenesis (DIT) and substrate oxidation after consumption of test drink containing either 100% vegetable fat (VEG‐test drink) or a mixture of 67% bovine milk fat with 33% vegetable fat (BOV‐test drink) (mean ± SEM, n = 19). The black circles (●) represent the VEG‐test drink, the open squares (□) represent the BOV‐test drink. The LMM did not reveal significant differences between the test drinks with respect to the time courses of A) DIT, B) Fat oxidation rate, and C) Glucose oxidation rate (respectively p = 0.80, p = 0.91, and p = 0.91).