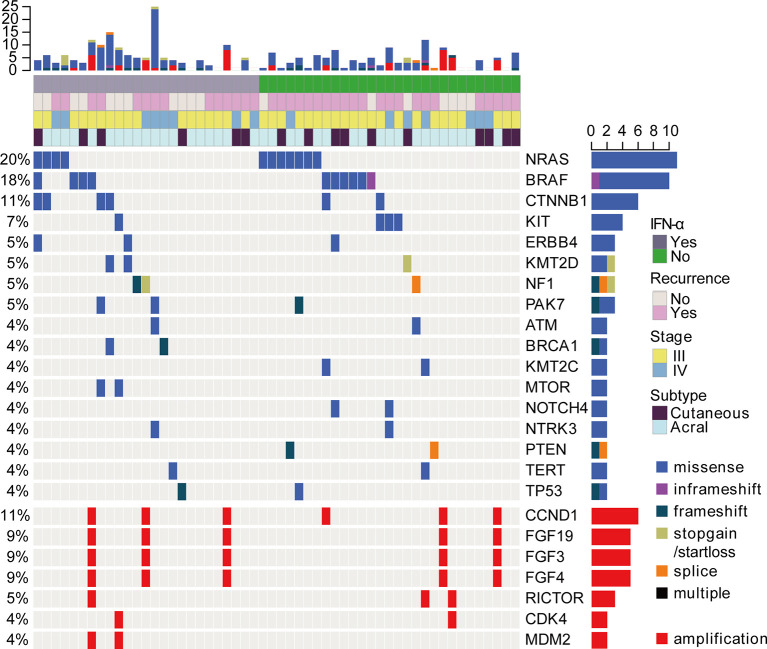
Figure 2.
The landscape of driver mutations and CNVs in acral (n = 40) and cutaneous (n = 16) melanomas by targeted NGS. Each column represents a case and each row represents a gene. The very top bar graph shows the number of mutations and CNVs detected in each sample. Recurrence after adjuvant pembrolizumab treatment, prior treatment, stage, and subtype are represented in the rows. The number on the left indicates the percentage of mutations or CNVs in 56 samples. The bar graph on the right shows the total number of mutations or CNVs for each gene. Mutation profiling was shown in the top panel. Copy number analysis was also analyzed and shown in the bottom panel.

