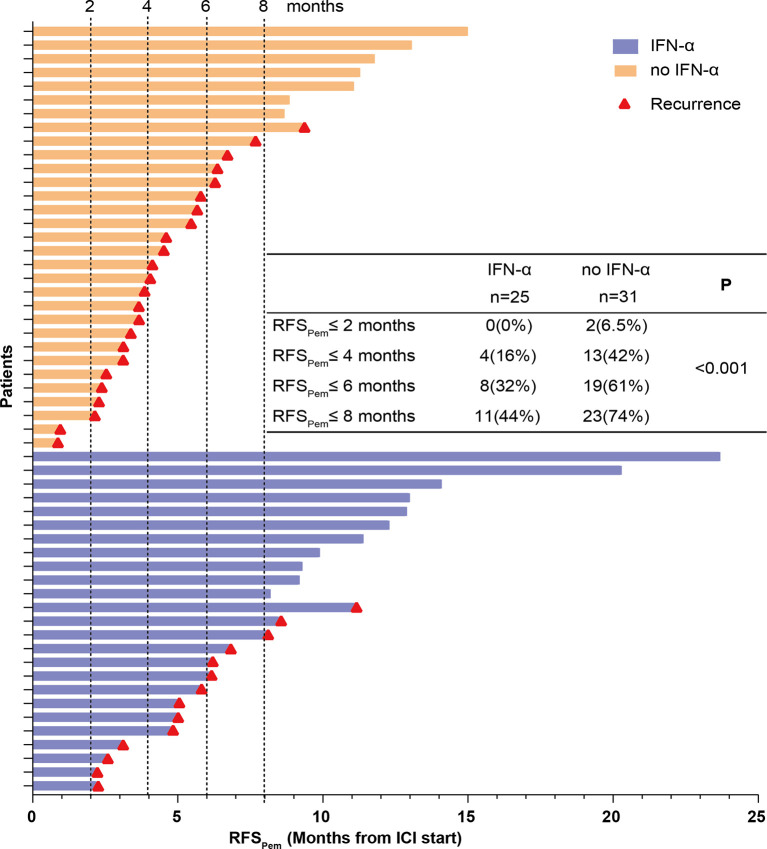
Figure 4.
RFSPem of all patients was summarized. Each row represents one patient. The length of each bar shows the time from start of adjuvant pembrolizumab treatment to the recurrence or the last follow-up. The red triangle indicates patients who developed a recurrence. The numbers and proportions of patients who developed a recurrence at different time points were calculated. The P value was generated from the Chi-Square test to compare the recurrence rates between the IFN-α and no IFN-α groups.

