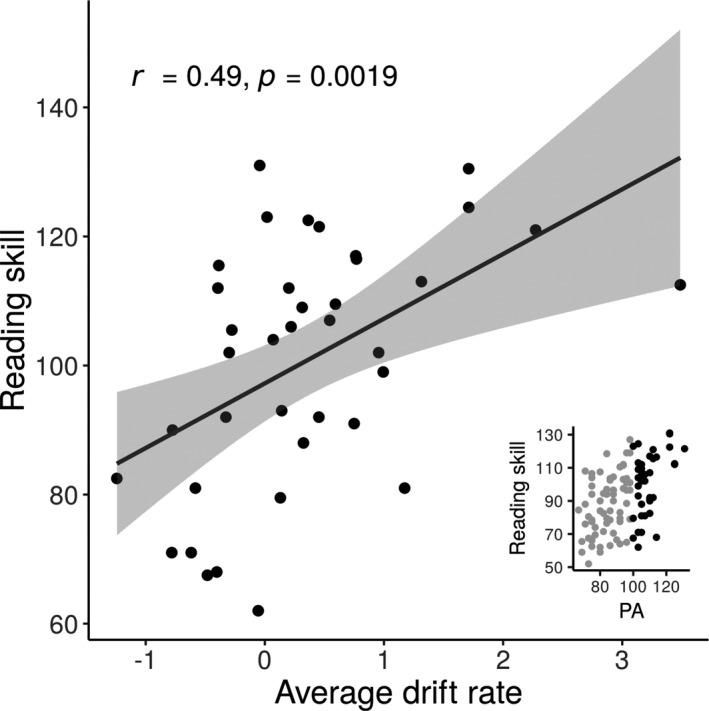
FIGURE 3.

The relationship between drift rate and reading skill in a subset of individuals with good phonological awareness. Average drift rate is calculated by averaging each individual's z‐scored drift rate estimates at each stimulus coherence level. Inset: a scatter plot indicating in black which subset of the study sample is included in the “good phonological awareness” group
