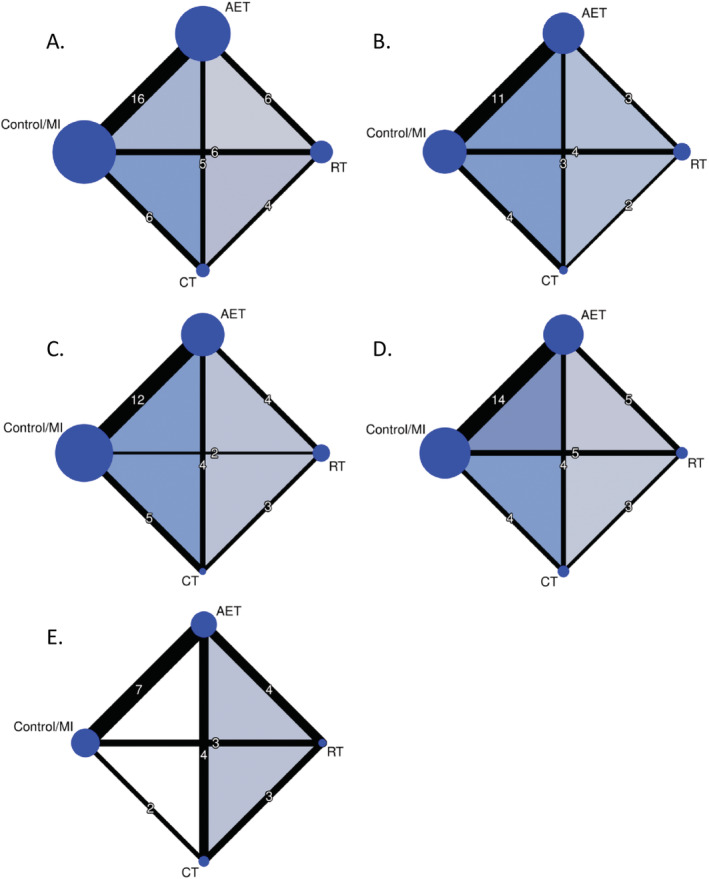
FIGURE 2.

Net graphs for (A) body weight, (B) body mass index, (C) waist circumference, (D) fat mass, and (E) fat‐free mass. The size of the nodes is proportional to the total number of participants allocated to exercise modality, and the thickness of the lines is proportional to the number of studies evaluating each direct comparison. AET, aerobic exercise training; CT, combined training; MI, minimal intervention; RT, resistance training
