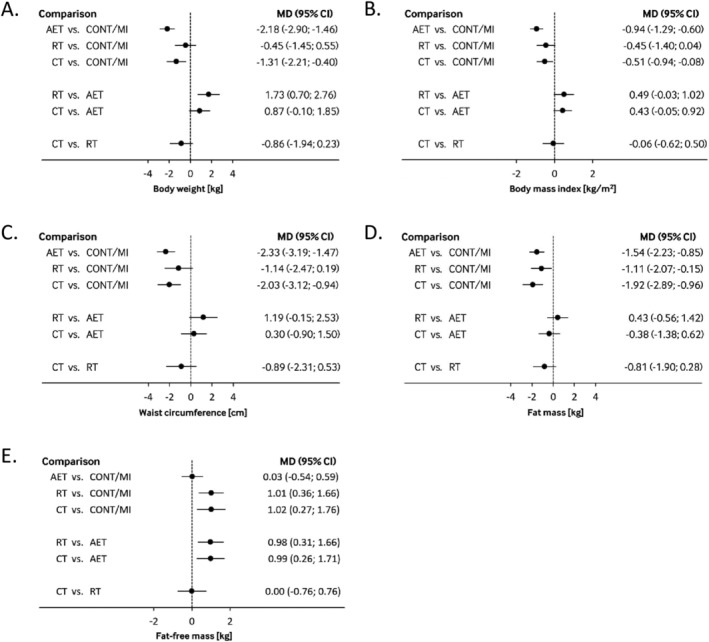
FIGURE 3.

Interval plot summarizing mean difference with 95% confidence interval for (A) body weight, (B) body mass index, (C) waist circumference, (D) fat mass, and (E) fat‐free mass as estimated from the network meta‐analysis for every possible pair of training modality. Negative values favor intervention on the left side. AET, aerobic exercise training; CONT, control; CT, combined training; MI, minimal intervention; RT, resistance training
