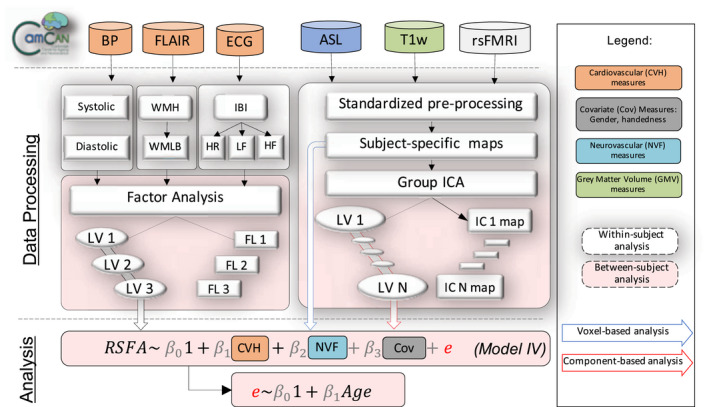
FIGURE 1.

Visual representation of the analysis strategy in terms of data inclusion (above top dotted line), processing (below top dotted line) either at a within‐subject level (white dotted‐line rectangles) or between‐subject level (peach‐color dotted‐line rectangles) and analysis (below second dotted line). Measures of cardiovascular health (CVH) included blood pressure (BP), heart rate variability (HRV) from electrocardiogram (ECG) recordings, white matter‐matter hyperintensities (WMH) from fluid‐attenuated inversion recovery (FLAIR) and BMI (not shown), all of which were submitted to factor analysis. Neurovascular function (NVF) estimates were based on cerebral blood flow from arterial spin labeling (ASL) acquisition. Grey matter volume (GMV) was estimated from a T1‐weighted MRI acquisition. Resting state fluctuation amplitudes (RSFA) were estimated from resting‐state fMRI BOLD acquisition. Regionally specific measures (RSFA, CBF, and GMV) were submitted to multiple linear regression either on a voxel‐level or on a component‐level using outputs from group ICA. ICA––independent component analysis; LV––latent variable; LST––lesion‐segmentation tool; PCA––principal component analysis; rsFMRI––resting state fMRI; TLV––total lesion volume; WMLB––white‐matter lesion burden
