
Figure 6.
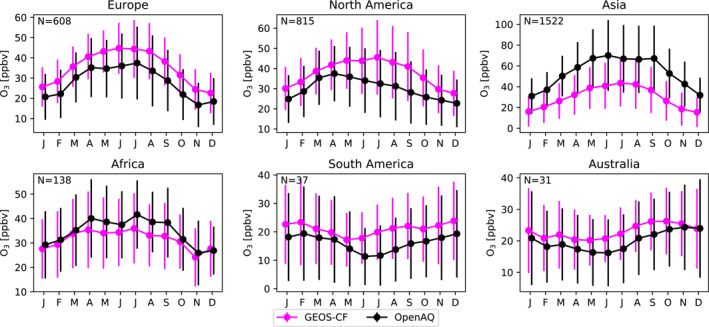
Monthly average surface O3 grouped into six regions (see Figure 2) as obtained from the OpenAQ database (black) and simulated by GEOS‐CF (magenta). Vertical bars represent the standard deviation of hourly variability across all sites. Number of sites is given in the inset. Y‐axis ranges vary by region.