
Figure 11.
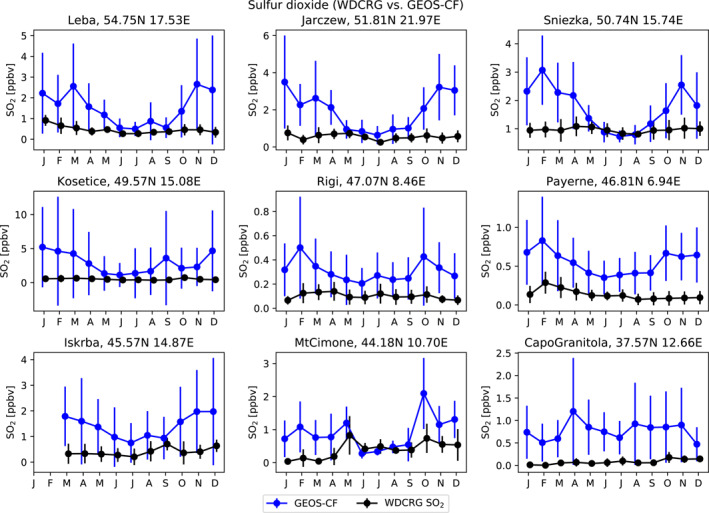
Monthly average surface SO2 as observed at nine GAW sites (black) and simulated by GEOS‐CF (blue). Vertical bars represent the standard deviation of hourly variability. Y‐axis ranges vary by station.
Official websites use .gov
A
.gov website belongs to an official
government organization in the United States.
Secure .gov websites use HTTPS
A lock (
) or https:// means you've safely
connected to the .gov website. Share sensitive
information only on official, secure websites.
Monthly average surface SO2 as observed at nine GAW sites (black) and simulated by GEOS‐CF (blue). Vertical bars represent the standard deviation of hourly variability. Y‐axis ranges vary by station.