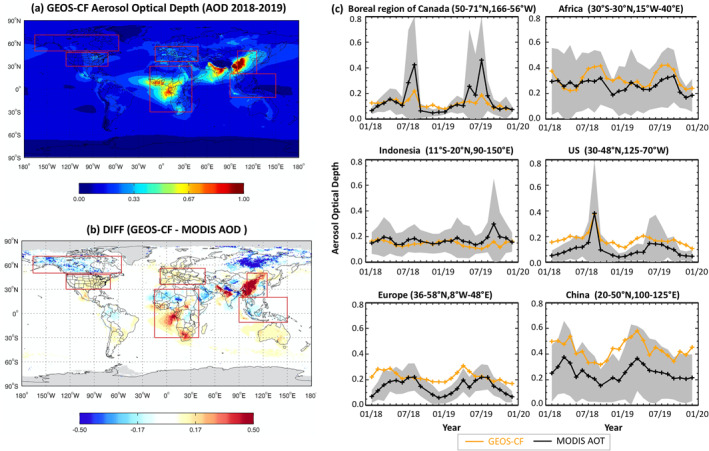
Figure 15.

Comparison of GEOS‐CF against MODIS Aerosol Optical Depth (AOD). Top left panel shows the 2018–2019 average total AOD as simulated by GEOS‐CF. Bottom left panel shows the difference between model simulated total column and MODIS observations. Right panel shows the total AOD time series averaged for six regions, as shown on the left.
