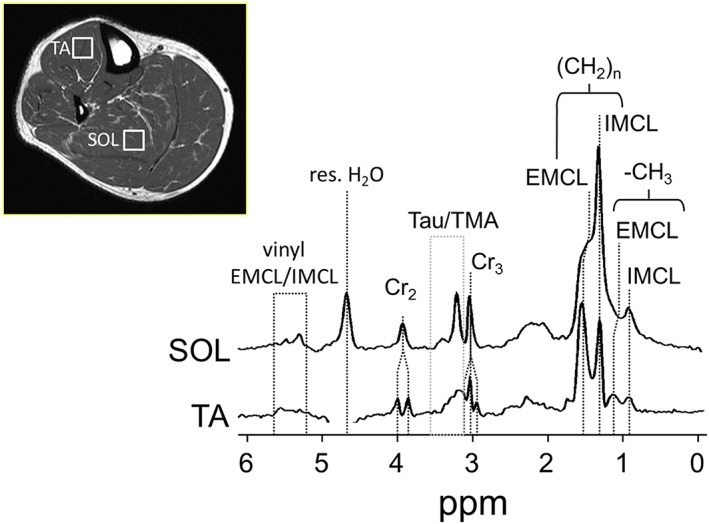
FIGURE 3.

Representative 1H MR spectra of skeletal muscle recorded from the tibialis anterior (TA) and soleus muscle (SOL) at 3 T (PRESS, TE = 30 ms). The different fiber orientation in each muscle group gives rise to different spectral appearance due to dipolar (creatine 3.05 and 3.9 ppm, taurine and TMA 3.2 ppm) or susceptibility (IMCL/EMCL 0.9‐1.5 ppm). Adapted with permission from Popadic Gacesa et al6
