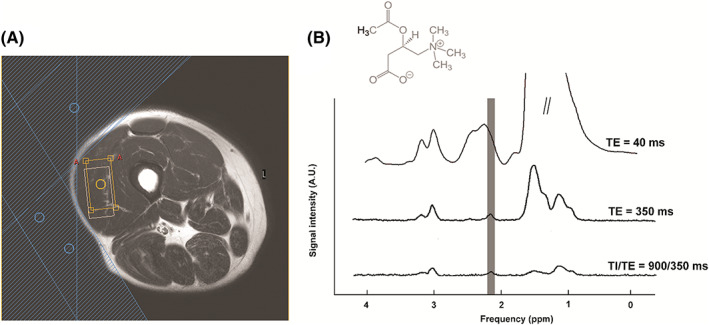
FIGURE 9.

1H spectrum of the skeletal muscle acetylcarnitine. (A) Scout image depicting the position of the voxel in vastus lateralis (orange box), possible chemical shift displacement artefact between water and lipid resonances (white box), and three outer volume suppression slabs applied (blue shaded area). (B) Chemical structure of acetylcarnitine and spectra acquired with short TE of 40 ms (upper trace), long TE of 350 ms (middle trace), and a combination of long TE and T1 inversion editing (TE = 350 ms, TI = 900 ms; lower trace). Improvement in detection and spectral resolution of acetyl carnitine methyl moiety at 2.13 ppm can be observed
