
Fig. 6.
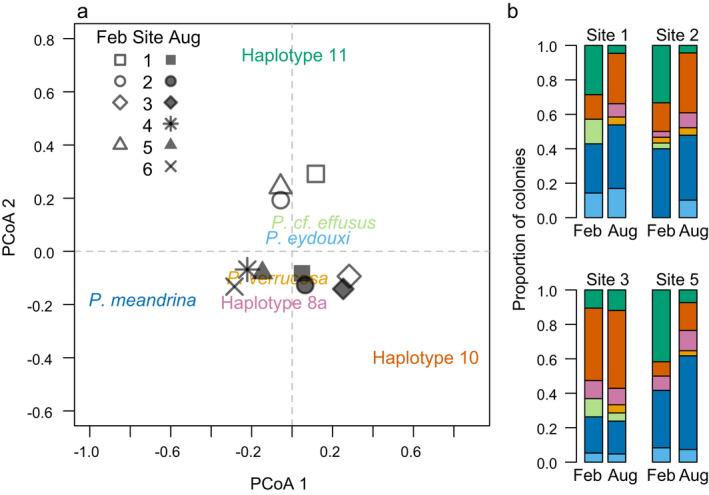
(a) Biplot of Principal Coordinate Axes (PCoA) and (b) barplots visualizing differences in the relative abundance of haplotypes before (February 2019) and after bleaching (August 2019) at 10 m depth at multiple sites on the fore reef of Moorea.