
FIGURE 4.
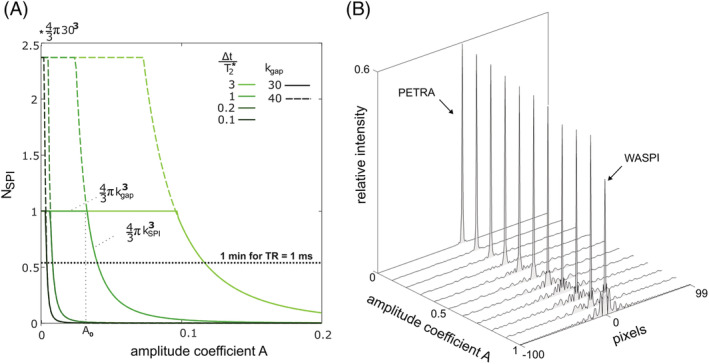
Influence of the HYFI amplitude coefficient A on scan time and depiction fidelity. (A) The number of excitations N SPI required to fill the single‐point imaging (SPI) core largely describes possible savings in scan time. It is plotted as a function of A for different ratios Δt/ T 2* and gap sizes kgap. For a given gap and ratio, as A increases, N SPI stays constant up to a particular value and then starts diminishing. For A < A0, kSPI > kgap and the whole inner k‐space is acquired with SPI, thus requiring number of radio‐frequency excitations for Cartesian Nyquist sampling. ‡ For A > A0, part of the inner k‐space can be acquired radially because kSPI < kgap and less excitations are needed in the core ( ). In summary, this figure shows that for common situations where Δt is smaller to or comparable with T 2*, the volume of data that needs to be acquired in a time‐consuming SPI manner rapidly decreases to almost negligible values, even with relatively small amplitude coefficient. Assuming a TR of 1 ms, this allows reducing scan time by several minutes compared with PETRA. (B) Point spread function (PSF) lineshapes changing with A. Calculations were performed assuming T 2* = 100 dk and k gap = 30 dk. As A increases from 0 (PETRA) to 1 (WASPI), the main lobe amplitude decreases and side lobes build up. Importantly, the PSF lineshapes are well preserved for A ≈ 0.1, at which N SPI is substantially decreased. Hence, HYFI is expected to reduce scan time while preserving image quality. More detailed PSFs are shown in Figure S1. Note that PETRA and WASPI acquisitions are also obtained with values of A slightly larger than 0 and smaller than 1, respectively (c.f. Matlab script for more details)