
FIGURE 6.
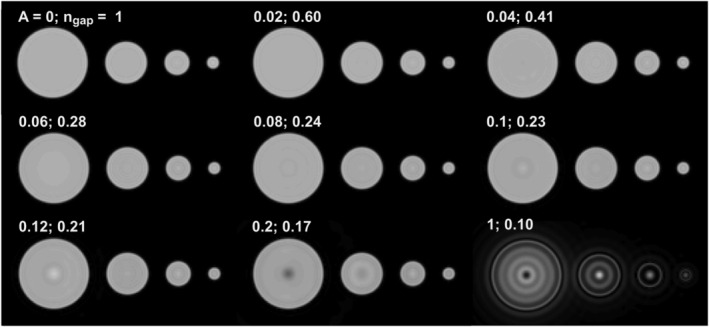
3D HYFI simulations illustrating the effect of the amplitude coefficient A on image quality and scan efficiency. Imaging of spheres with 50, 30, 18 and 9 mm diameter was simulated assuming T 2 = 100 μs and k gap = 30 dk. Other parameters are listed in Table 1 and Table S8 in the supporting information. Savings in scan time are quantified with n gap, the number of excitations needed to acquire the inner k‐space relative to the case A = 0. As A increases from 0 (PETRA) to 1 (WASPI), k SPI decreases and n gap decreases. The latter quickly reaches 28% (A = 0.06) with preserved image quality. Above this value, n gap decreases slower and artifacts start to appear in the center of the larger spheres, suggesting that for such samples the optimal amplitude coefficient A resides below 0.1. Image profiles of a few representative cases are shown in Figure S2