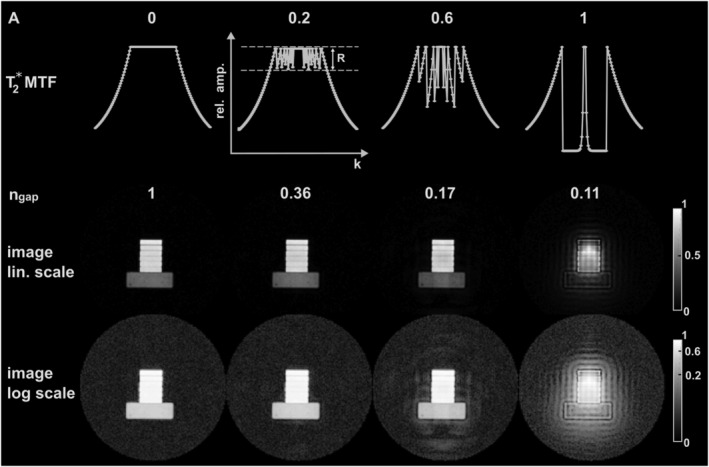
FIGURE 7.

Demonstration of the HYFI principle in a phantom experiment. The first row represents the amplitude coefficient A growing from 0 (PETRA) to 1 (WASPI) with intermediate values corresponding to HYFI. Underneath are the associated 1D k‐space T 2*‐related modulation transfer functions (MTFs) (c.f. Figure 3) and the relative number of excitations required to fill the gap, n gap. The resulting images are shown in the two bottom rows with linear (lin.) and logarithmic (log) grayscales. They illustrate the importance of the parameter selection in HYFI. Indeed, at small A, the scan time is reduced and image quality is preserved, while at large A, the strong T 2* weighting in the gap leads to image artifacts
