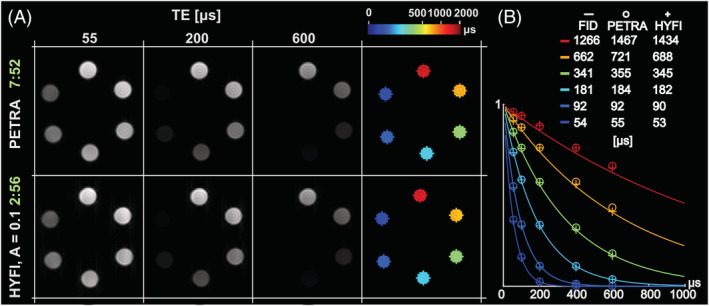
FIGURE 11.

T 2* mapping in MnCl2 solutions with rapid transverse relaxation. (A) Series of PETRA and HYFI images taken at different echo time TE = ∆t = 55, 100, 200, 400 and 600 μs (only a subset is displayed). Maps of transverse relaxation times were obtained by pixel‐wise fitting the signal decay (last column). The scan time of individual images is given in min:s (green), which shows a considerable reduction for HYFI. (B) The relative intensities of the signal averaged over each sample are plotted as a function of TE (circles and crosses) and overlaid with the free induction decay (FID) measured in each MnCl2 solution (solid line). Fitted single‐exponential T 2* values are given in the legend. These results demonstrate that T 2* of very rapidly decaying signal can be mapped efficiently with the HYFI technique
