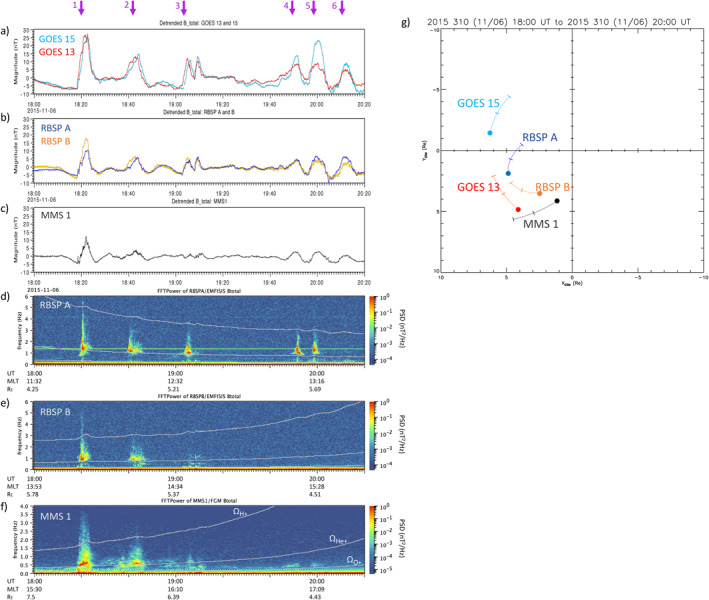
Figure 3.

(a–c) Detrended magnetic field measurements at GOES 13 and 15, RBSP A and B, and MMS 1, respectively. (d–f) Magnetic field spectrograms showing bursts of EMIC wave activity at RBSP A, B, and MMS 1. White lines indicate the local H+, He+, and O+ cyclotron frequencies. (g) The location of these five spacecraft from 18:00 to 20:00 UT, with filled circles indicating the location at 20:00 UT.
