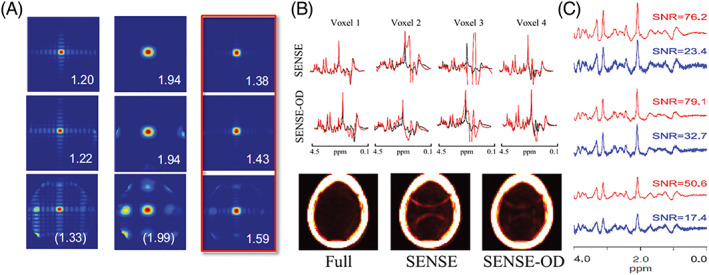
FIGURE 10.

Lipid aliasing control by overdiscrete SENSE MRSI reconstruction. A, SRFs for different acceleration factors (top row ‐ R=1; middle row ‐ R=2; bottom row ‐ R=2x2) after standard SENSE reconstruction (left column), a Hamming filtered version of it (middle column) and an overdiscrete, spatial‐response function target based SENSE reconstruction (right column). B, Spectra and lipid maps from fully sampled, SENSE and SENSE‐OD reconstruction (2 × 2 acceleration each) of 1H‐FID‐MRSI data from 9.4 T. C, SNR after SENSE (blue) and SENSE‐OD (red) reconstruction of 7 T 1H‐FID‐MRSI data. Reproduced from the work of Kirchner et al. 192 , 193 and Nassirpour et al 55
