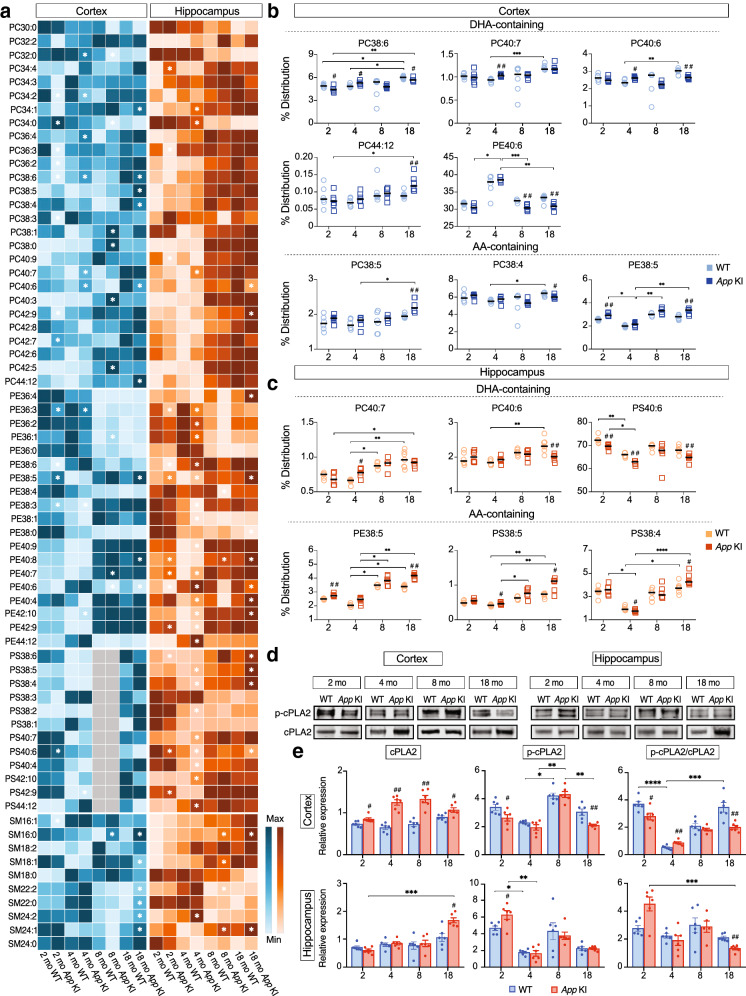
Fig. 4.
Deficiency in DHA-containing phospholipids in the brain of App KI mice. a Heat map analysis for PCs, PEs, PSs and SMs of 2, 4, 8 and 18 months-old WT (n = 4–6) and App KI mice (n = 6–7). Rows represent the mean values for phospholipids (PC, PE, PS, SM) and columns represent different ages of WT and App KI mice. Grey colour represents undetected values. b, c Scatter plots for DHA- and AA-containing phospholipids. Horizontal bars indicate median. App KI mice showed a marked increase in AA-containing phospholipids and decrease in DHA-containing phospholipids in both cerebral cortex and hippocampus at 18 months of age. Comparisons between genotypes were performed with Mann–Whitney U test, #P < 0.05, ##P < 0.01, ###P < 0.001. Comparisons between different ages and genotypes were performed by Kruskal–Wallis one-way analysis of variance test with Dunn’s multiple comparisons post hoc test, *P < 0.05, **P < 0.01, ***P < 0.001, ****P < 0.0001. d Western blots for cPLA2 and p-cPLA2 in cortex and hippocampus. e Densitometric analysis of representative bands showed increasing levels of cPLA2 with age in App KI mice and a decrease in the phosphorylation rate of cPLA2. The data represent means ± SEM from 6 animals/group. Genotype comparisons were applied using Mann–Whitney U test (#P < 0.05, ##P < 0.01, ###P < 0.001) and multiple comparisons were performed with Kruskal–Wallis test and Dunn’s post hoc test (*P < 0.05, **P < 0.01, ***P < 0.001, ****P < 0.0001). PC = phosphatidylcholine, PE = phosphatidylethanolamine, PS = phosphatidylserine, SM = sphingomyelin, AA = arachidonic acid, DHA = docosahexaenoic acid, EPA = eicosapentaenoic acid, p-cPLA2 = phosphorylated (ser505) cytosolic phospholipase 2

