Fig. 5.
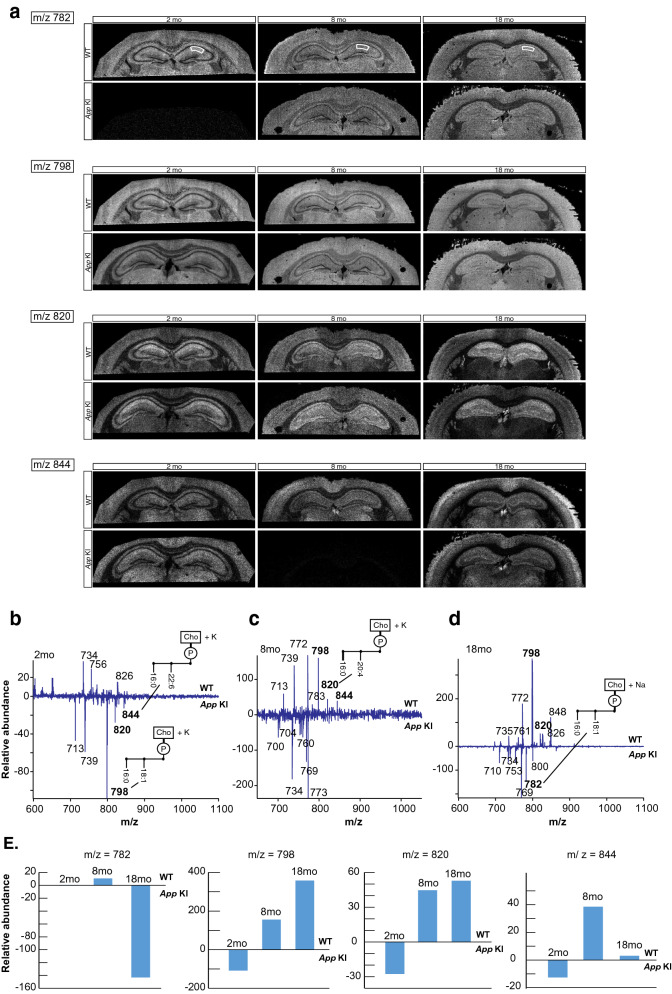
Differential MALDI spectra reveal compensatory PCs generated in App KI hippocampus region. a Lipid images of coronal mouse brain sections generated from positive ion mode data, illustrating the difference of abundance of specified lipids (m/z = 782, 798, 820 and 844) according to the age (2, 8 and 18 months) and phenotype of the mice (WT and App KI). The sections are of similar coronal levels of the brain. Encircled areas correspond to the region from which the lipid spectra were extracted, i.e. stratum radiatum within the CA1 region of each individual brain section to generate the differential MALDI spectra in B-D. b–d The differential spectra were constructed by subtracting the App KI profile from the WT profile and the resulting plots show relative abundances of the prevalent lipids in WT (pointing up) and lipids in App KI (pointing down). Molecules that are more abundant in stratum radiatum of WT mice are presented in the upper part of each graph, while molecules more abundant in App KI are displayed in the lower part. The different molecules show fluctuation of their relative abundance with age. e The difference of abundance of four molecules (m/z = 782, 798, 820 and 844) that display a switch in their level as the animal ages are shown, where m/z = 782 and 798 correspond to the same molecule PC (16:0/18:1) associated with Na+ adduct and K+ adduct, respectively, while m/z = 820 corresponds to the AA-containing PC, PC (16:0/20:4) associated with K+ adduct, and m/z = 844 corresponds to DHA-containing PC, PC (16:0/22:6) associated with K+ adduct. CA1 = Cornu Ammonis 1, MALDI-IMS = matrix-assisted laser desorption/ionization-imaging mass spectrometry, PC = phosphatidylcholine, WT = wild-type

