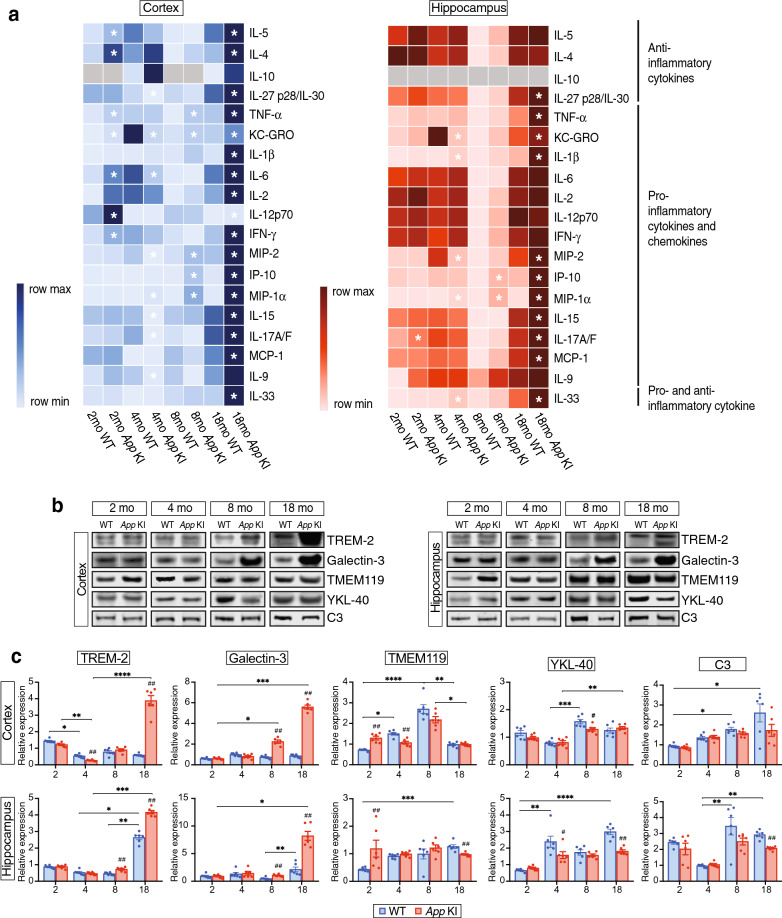
Fig. 6.
App KI mice show most marked changes in inflammatory factors at 18 months of age. a Cytokines and chemokines were analyzed in homogenates of cerebral cortex and hippocampus by Meso scale v-plex assay. Rows in the heat map represent cytokines/chemokines and the columns represent different ages of WT and App KI mice. The colours represent mean of normalized concentration values (light blue and light red are low and dark blue and dark red are high). Grey colour represents undetected values. Sample size in each group was 5–6. Asterisks denote statistical significance between WT and App KI mice, where P < 0.05 using Mann–Whitney U test. b Western blot analysis of TREM-2, Gal-3, TMEM119, YKL-40 and C3 in cortex and hippocampus of 2-, 4-, 8- and 18-months-old mice (n = 6/group). c Densitometric analysis of bands after normalization with total protein and internal control. Intergroup comparisons were performed with Mann–Whitney U test (#P < 0.05, ##P < 0.01, ###P < 0.001). Multiple comparisons were performed with Kruskal–Wallis one-way analysis of variance test and Dunn’s post hoc test (*P < 0.05, **P < 0.01, ***P < 0.001, ****P < 0.0001). TREM-2 = triggering receptor expressed on myeloid cells 2, Gal-3 = galectin-3, TMEM119 = transmembrane protein 119, YKL-40 = chitinase-3-like protein 1, C3 = complement component 3

