Fig. 2.
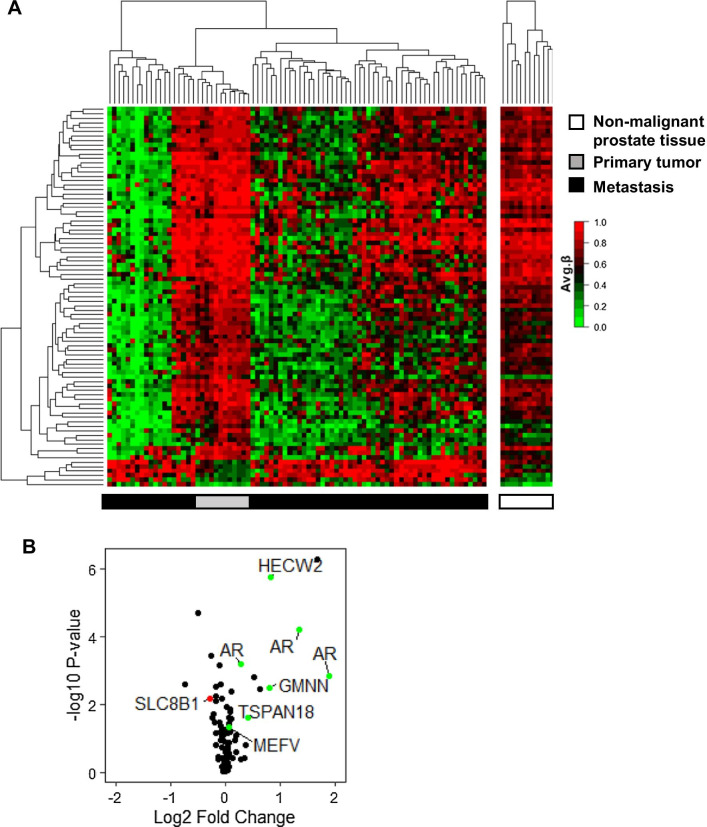
Integrated analysis of promoter DNA methylation and gene expression in metastases and primary tumors. A Heatmap showing the 85 unique differently methylated CpGs (identified in Fig. 1C) between the primary tumors (T) (n = 12) and the bone metastases (M) (n = 70). B Vulcano plot of the corresponding gene expression. 6 unique genes that were either hypermethylated with decreased gene expression (red) or hypomethylated with increased gene expression (green) in metastasis compared to primary tumors are indicated. The AR is represented by 3 different gene probes in the Illumina BeadChip array data, corresponding to two AR transcripts (coding for the full-length AR and the AR45 splice variant)

