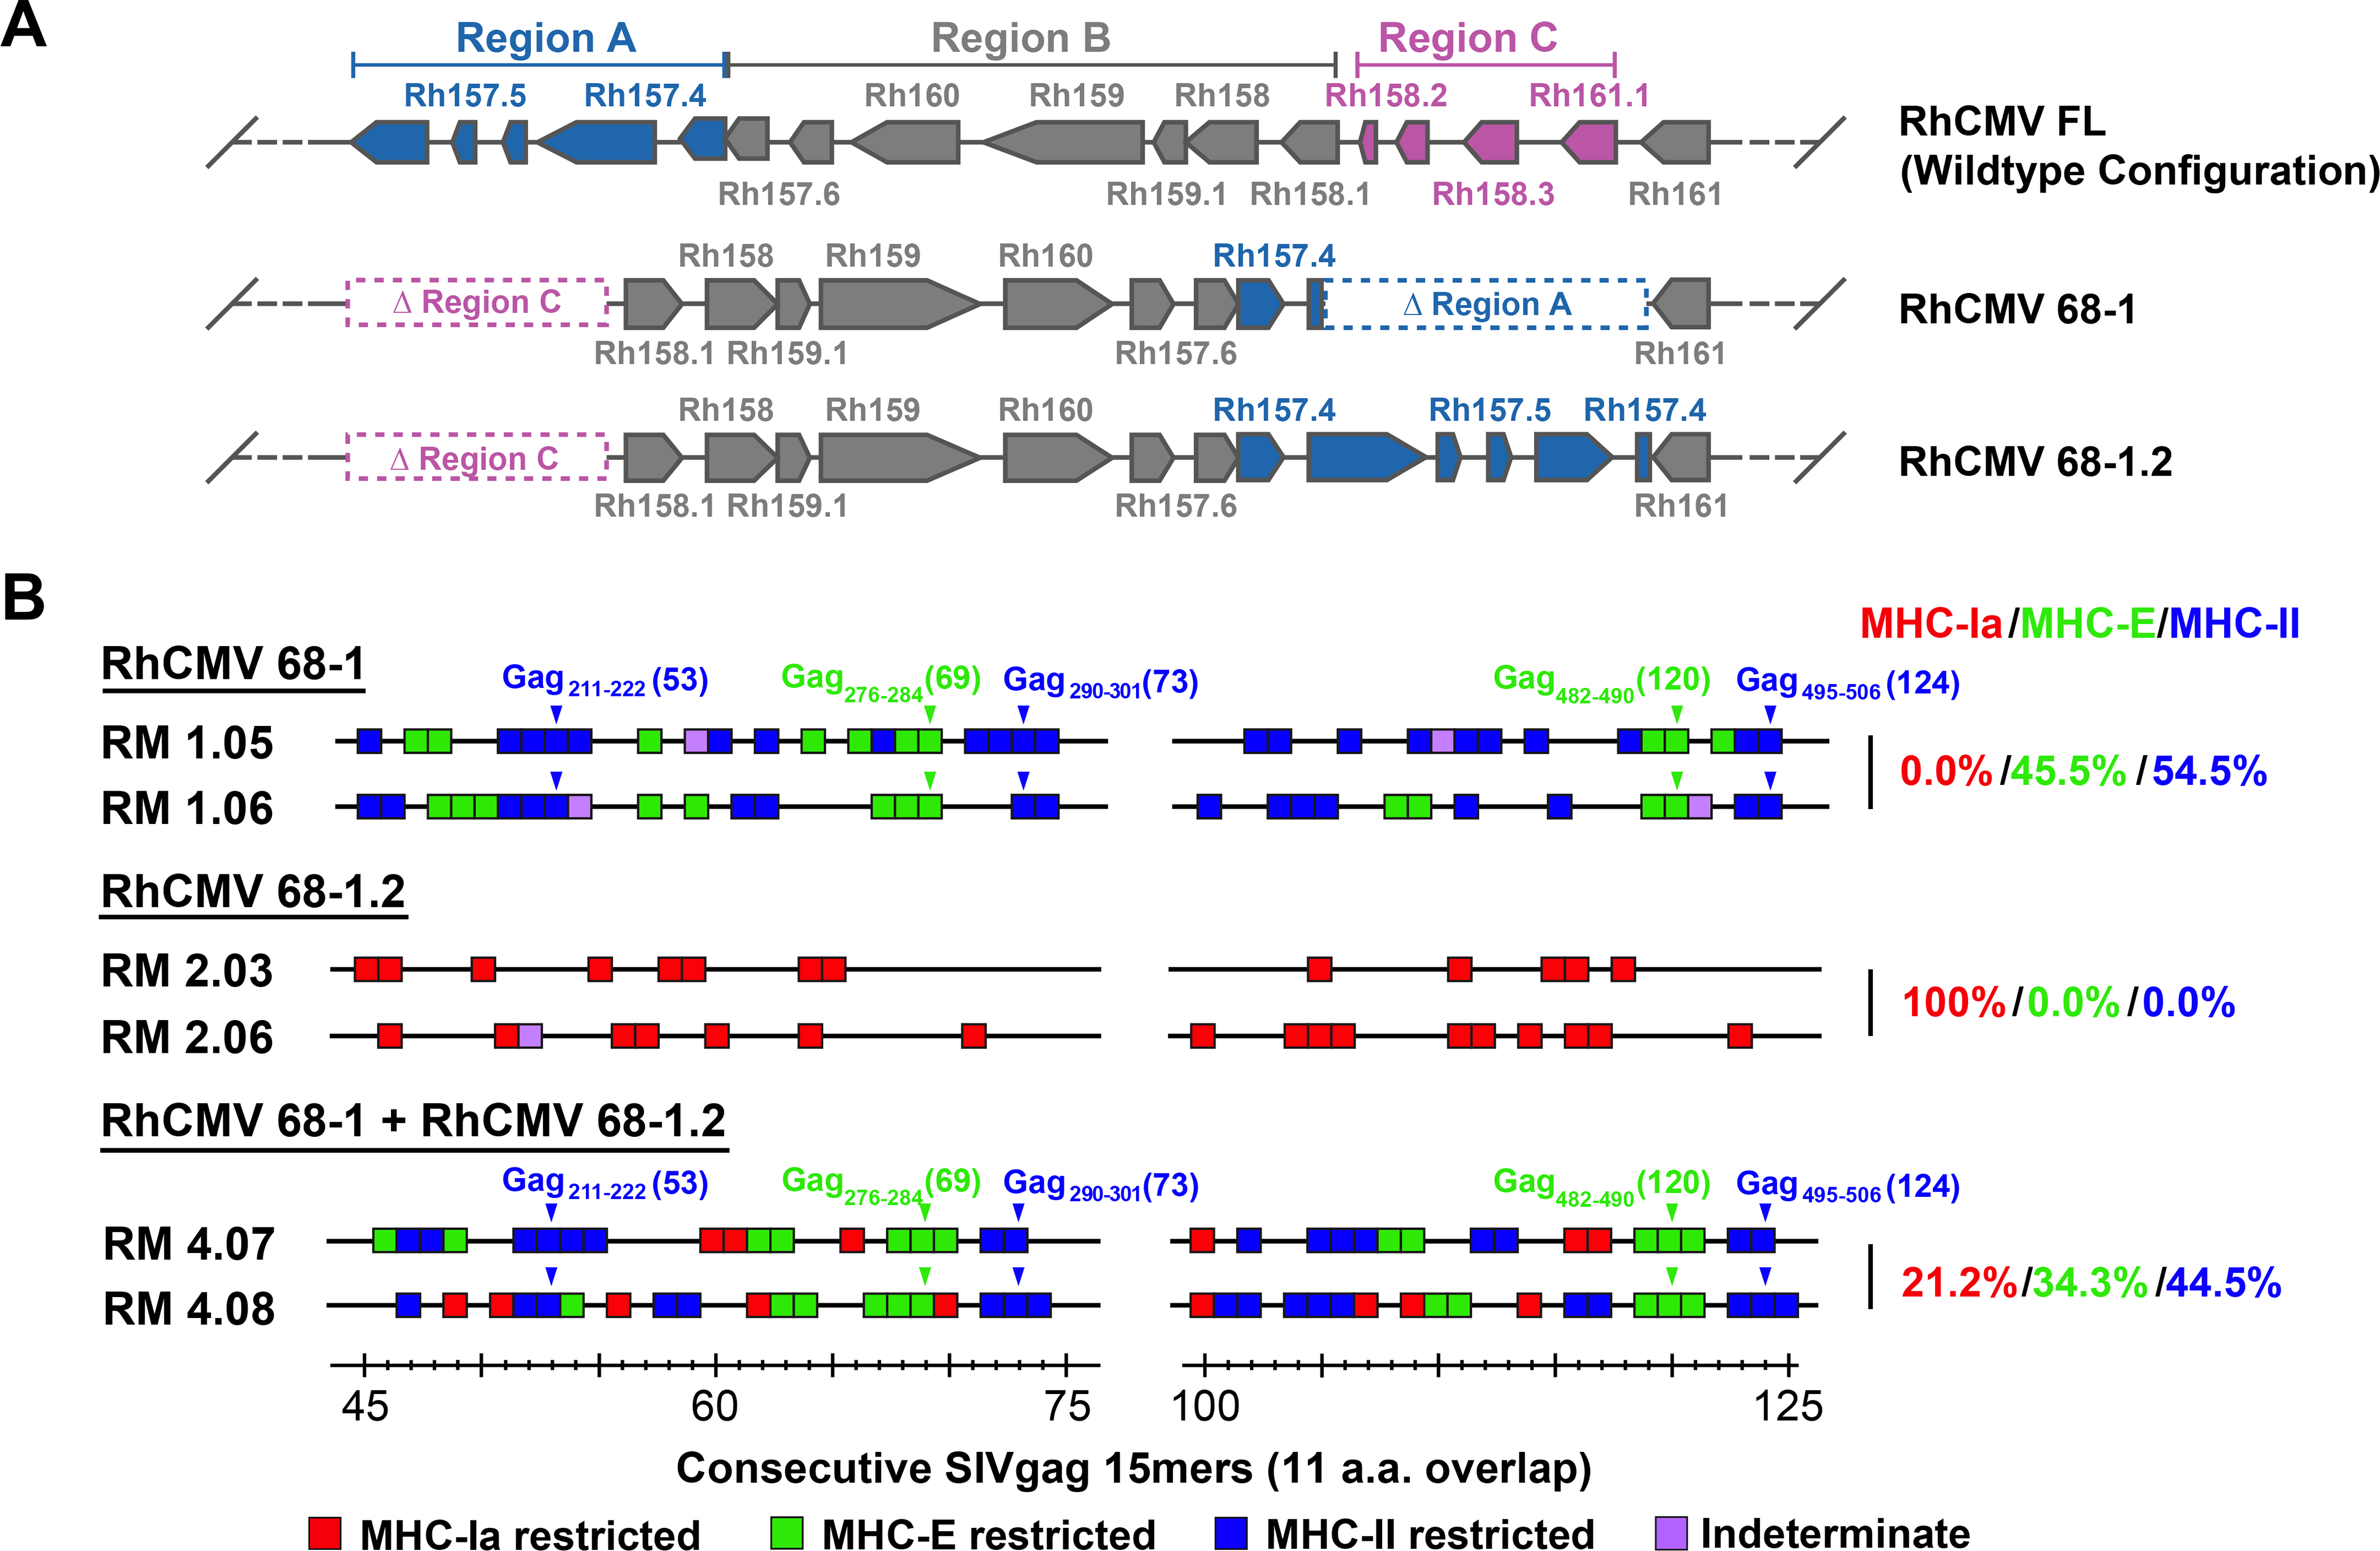
Figure 1. RhCMV strain differences.

(A) Schematic of the genetic differences between 68–1, 68–1.2, and FL (wildtype) RhCMV in the region of the genome encoding the pentameric complex (analogous to the ULb’ region of HCMV), showing the inversion-deletion event that occurred during in vitro passage of the 68–1 strain and its partial repair in 68–1.2 (with pointed boxes representing distinct exons, the point indicating the 3’ end of the ORF). The genomic segments of inversion and deletion indicated by the letters A, B and C were adapted from Oxford at al. (11). (B) Representative MHC restriction analysis of SIVgag-specific CD8+ T cell responses elicited by strain 68–1 vs. 68–1.2 RhCMV/SIVgag vectors, alone and in combination, assessed by ICS analysis of consecutive 15mer peptides with 11 amino acid overlap comprising the SIVgag protein sequence. Boxes reflect any above-threshold single 15mer response, which were then color-coded based on MHC restriction type analysis (see Methods). In addition, responsiveness to the designated MHC-E and MHC-II optimal supertope peptides are indicated by green and blue arrowheads, respectively. The figure shows only the SIVgag regions from amino acid 45–75 and amino acid 100–125 (the regions including the supertopes) of 2 representative RMs, but complete epitope analysis results are presented in table S1. These overall data were used to calculate the % of the total MHC restriction-assignable SIVgag epitopes that were MHC-Ia-, MHC-E-, and MHC-II-restricted, shown at right in red/green/blue, respectively.
