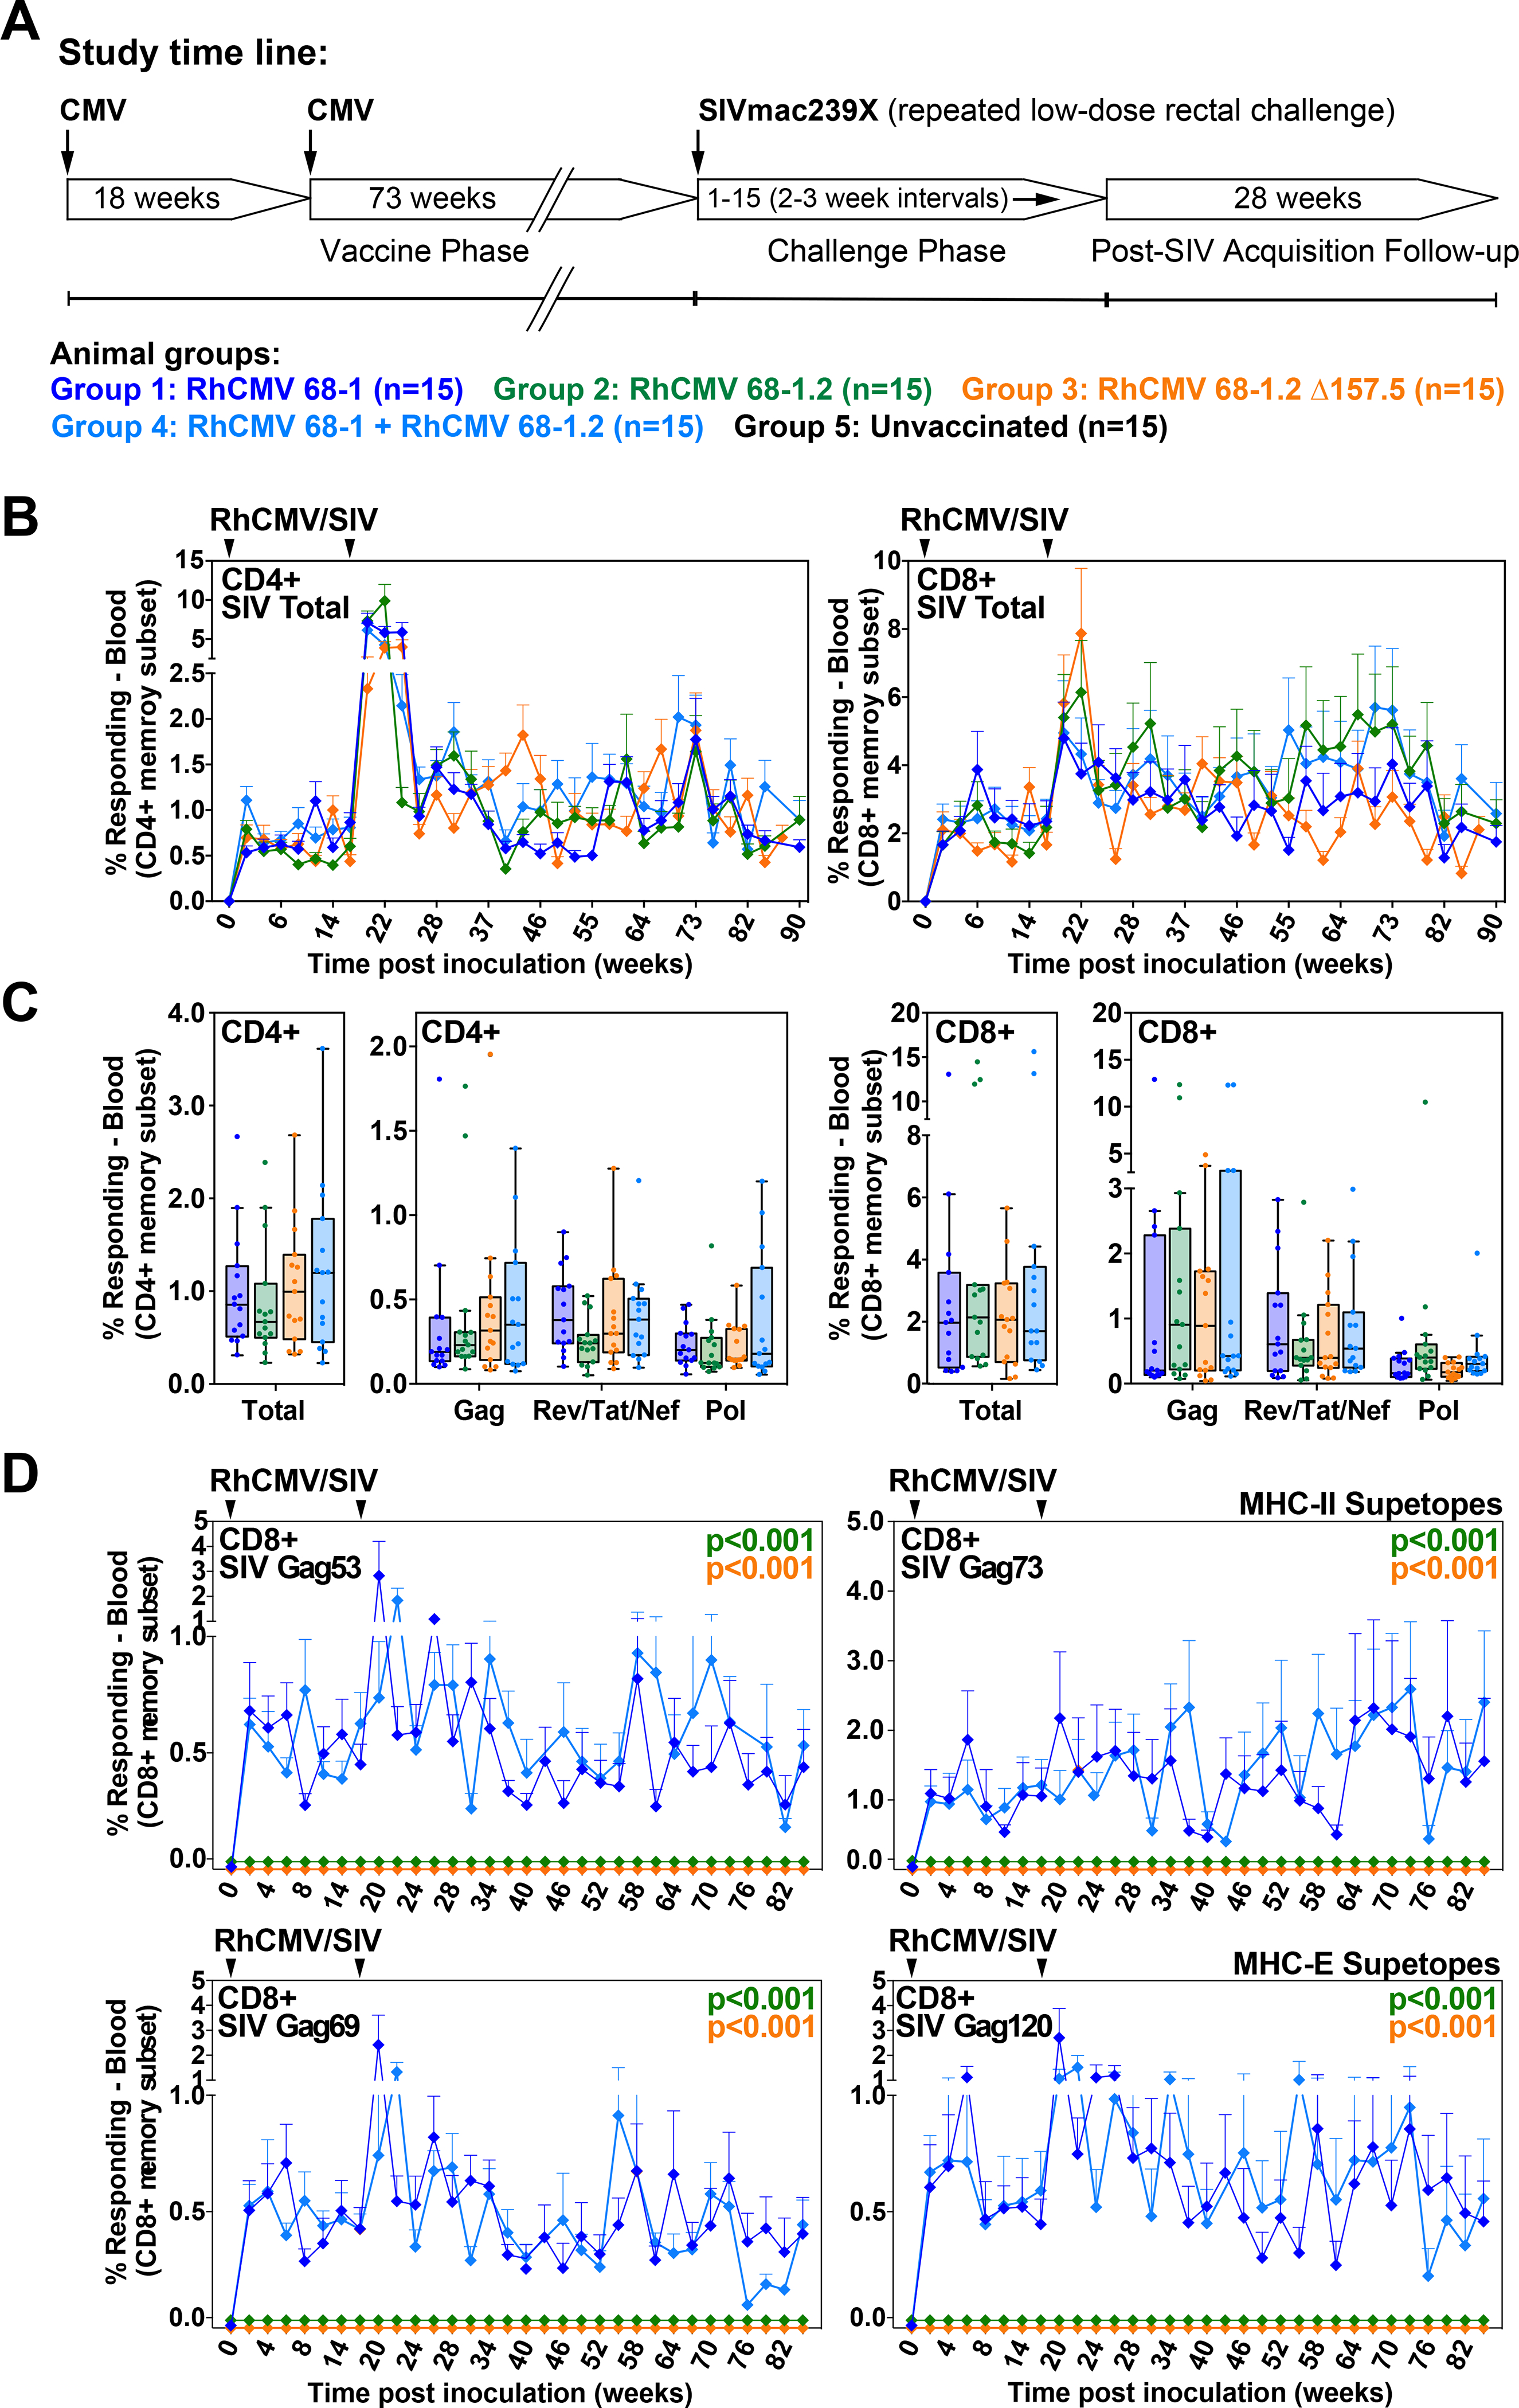
Figure 6. Immunogenicity of differentially CD8+ T cell response-programmed RhCMV vectors.

(A) Protocol for the comparison of the immunogenicity and efficacy of 68–1, 68–1.2, and ΔRh157.5 68–1.2 RhCMV/SIV vector sets (each set comprised of 3 vectors individually expressing SIV Gag, Rev/Tat/Nef, and 5’-Pol inserts), and the combination of 68–1 and 68–1.2 vector sets (n = 15 RMs per group). (B,C) Longitudinal and plateau-phase analysis of the vaccine-elicited SIV Gag-, Rev/Tat/Nef-, and 5’-Pol-specific CD4+ and CD8+ T cell responses in peripheral blood of the RMs vaccinated with the designated vector sets. In B, the background-subtracted frequencies of cells producing TNF and/or IFN-γ by flow cytometric ICS assay to peptide mixes comprising each of the SIV inserts within the memory CD4+ or CD8+ T cell subsets were summed for overall responses with the figure showing the mean (+ SEM) of these overall responses at each time point (area-under-the-curve was used to quantitatively compare longitudinal response profiles). In C, boxplots compare the total and individual SIV insert-specific CD4+ and CD8+ T cell response frequencies between the vaccine groups during the vaccine phase plateau (each data point is the mean of response frequencies in all samples from weeks 61–90 post-first vaccination). (D) Longitudinal analysis of the vaccine-elicited CD8+ T cell responses to MHC-E-restricted [Gag276–284 (69) and Gag482–490 (120)] and MHC-II-restricted [Gag211–222 (53) and Gag290–301 (73)] SIVgag supertopes in peripheral blood of each vaccine group by ICS assay. Wilcoxon p-values for comparison of all response parameters shown in panels B-D for the 68–1-only vaccine to all other vaccines (which are individually designated by the color code shown in panel A) are shown where significant (adjusted for multiple comparisons in panels C and D).
