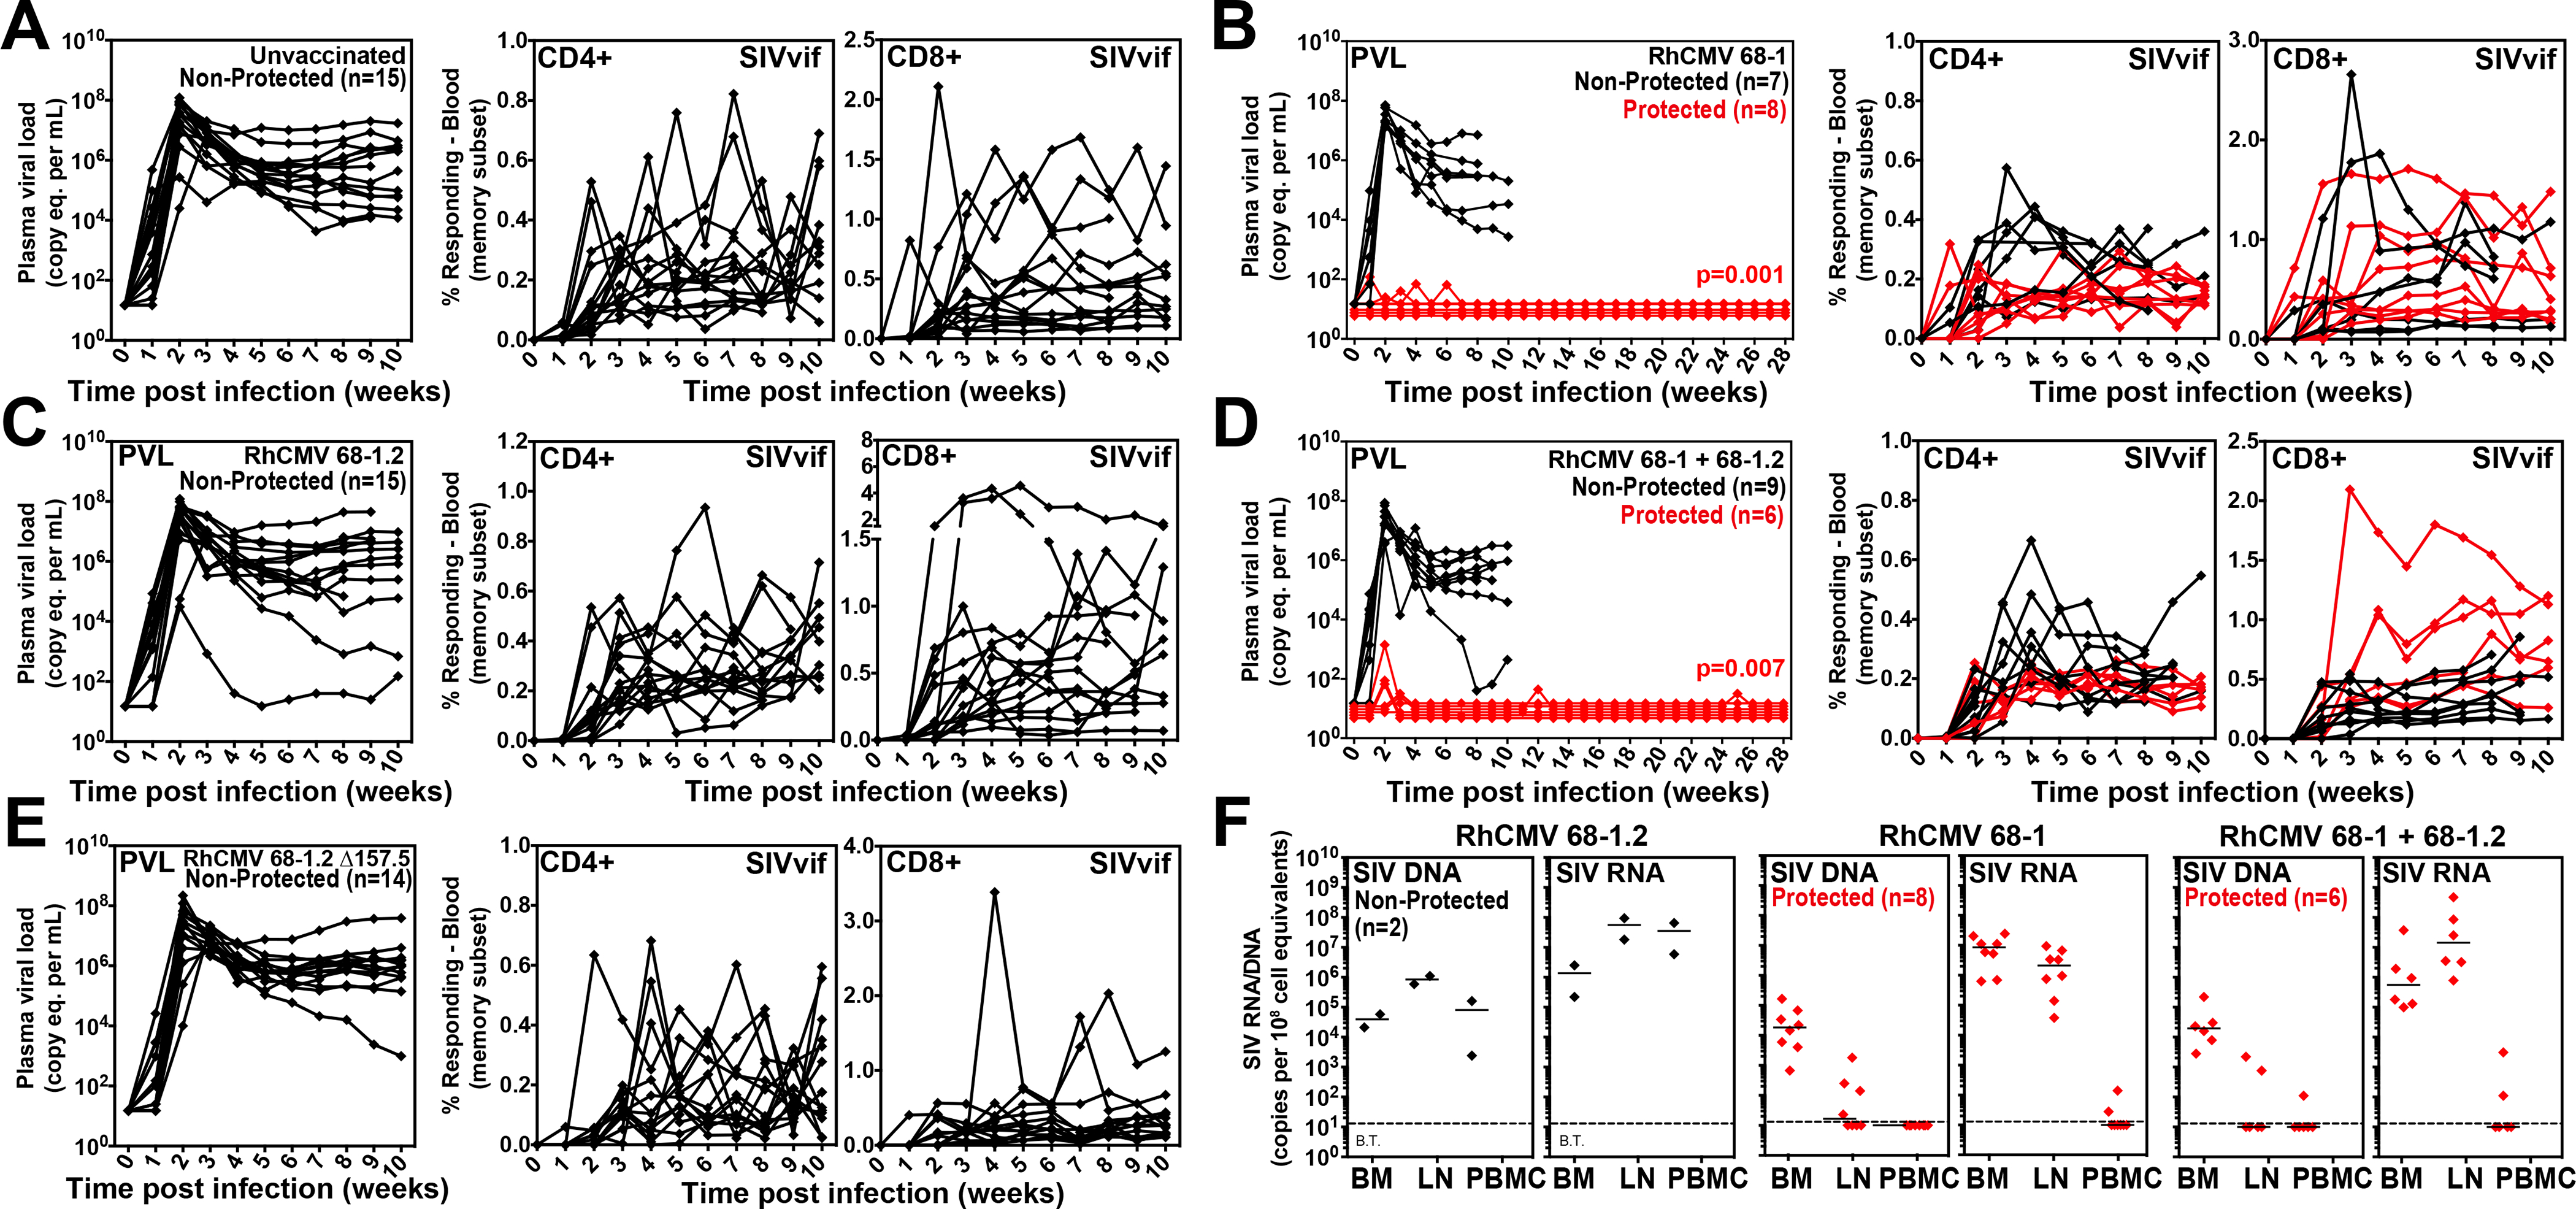
Figure 8. Efficacy of differentially programmed RhCMV vectors.

(A-E) Assessment of the outcome of SIV infection after repeated, limiting dose SIVmac239 challenge (see Fig. 6A) of the designated vaccine groups by longitudinal analysis of plasma viral load (left panels) and de novo development of SIVvif-specific CD4+ (middle panels) and CD8+ (right panels) T cell responses. RMs were challenged until the onset of any sustained above-threshold SIVvif-specific T cell response, with the SIV dose administered 2 or 3 weeks prior to the initial response detection considered the infecting challenge (week 0). The n in each panel reflects the total number of RMs with such documented take of SIV infection during the challenge period. RMs with sustained viremia were considered non-protected (black); RMs with no or transient viremia but demonstrating sustained above-threshold SIVvif-specific T cell responses were considered protected (red) (6–8). Binomial exact p-values are shown where the proportion of protected RMs in a vaccine group differs significantly from the unvaccinated group. (F) Bone marrow (BM), peripheral lymph node (LN) and peripheral blood mononuclear cell (PBMC) samples from all vaccine-protected RMs (red) and 2 non-protected RMs (black) for comparison (left panel), collected from between day 28 and 56 post-SIV infection, were analyzed by nested, quantitative PCR/RT-PCR for cell-associated SIV DNA and RNA. The dotted line indicates the threshold of detection (B.T. = below threshold) with data points below this line reflecting no positive reactions across all replicates.
