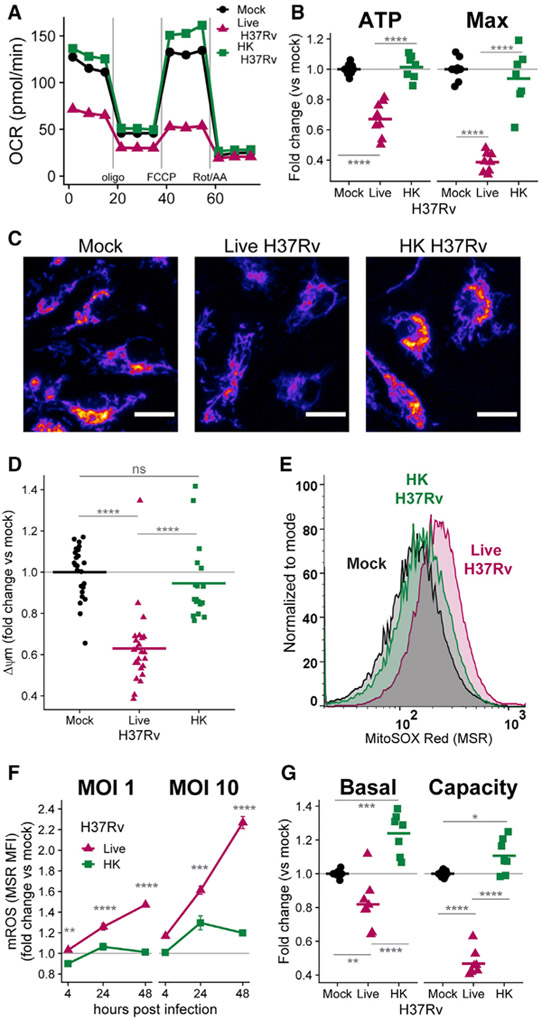
Figure 1. Live H37Rv decreases BMDM metabolism more than does heat-killed (HK) H37Rv.
(A) Oxygen consumption rate (OCR) in WT BMDMs 24 h after mock infection or infection with live H37Rv or HK H37Rv at an MOI of 10. A single representative plate is shown.
(B) Quantification of mitochondrial parameters derived from (A). The OCR dedicated to ATP production (ATP) or at maximal respiration (Max) was normalized to mock infection controls on each plate. Each dot represents a single well and bars represent the mean. Data from eight plates across three independent experiments. See also Figure S1.
(C) Representative images (original magnification, x20) of BMDMs either mock infected (left) or infected with live (middle) or HK (right) H37Rv (MOI of 10) and stained 24 h later with the mitochondrial membrane potential (Δψm)-sensitive dye TMRM (tetramethylrhodamine, methyl ester). TMRM intensity depicted with the “Fire” LUT from Fiji (Schindelin et al., 2012). Scale bars, 15 μm.
(D) Quantification of Δψm derived from (C). The TMRM mean fluorescence intensity (MFI) for each field of view was measured in CellProfiler (McQuin et al., 2018) and normalized to mock-infected wells. Each dot represents a single field of view collected across two independent experiments.
(E) Representative histograms of MitoSOX Red (MSR) fluorescence quantified with flow cytometry to measure mitochondrial reactive oxygen species (mROS) in BMDMs either mock infected or infected with an MOI of 10 of live H37Rv or HK H37Rv for 24 h.
(F) Quantification of mROS derived from (E). MSR MFI in each condition was normalized to mock-infected controls at each time point. Means for four technical replicates ± SEM are shown for a representative experiment of three independent experiments.
(G) Fold change in basal glycolysis or glycolytic capacity was calculated relative to mock-infected controls on each plate. Each dot represents a well and bars represent the mean from eight plates across three independent experiments.

