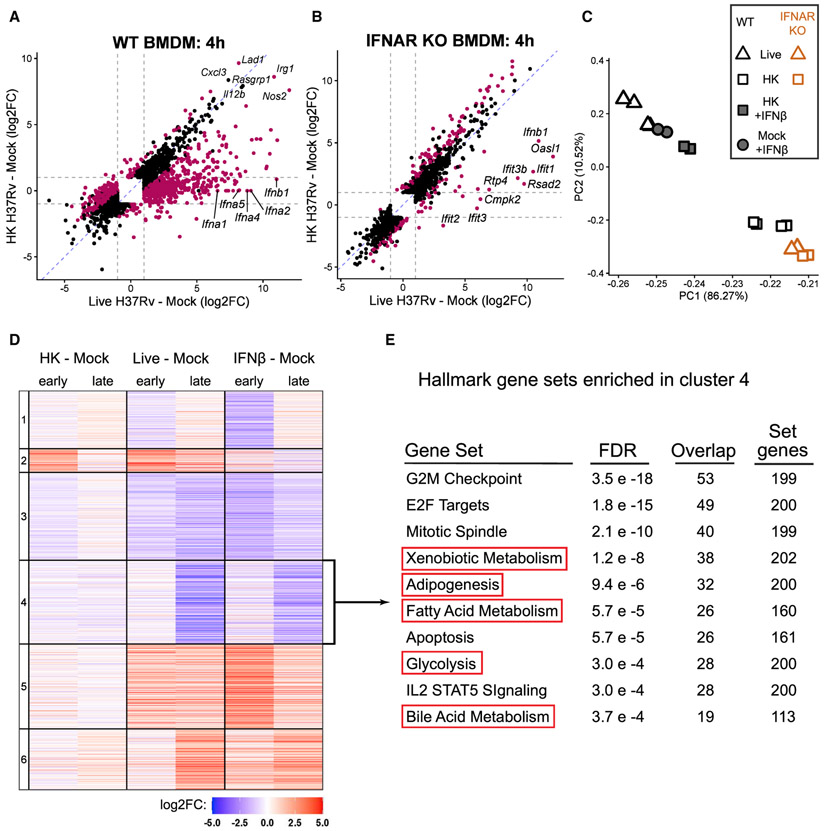
Figure 2. Type I IFN dominates BMDM transcriptional response to live Mtb and correlates with metabolic changes.
(A) Scatterplot of log2FC values of the 2,210 genes differentially expressed (DE) (FDR < 0.001, ∣log2FO∣ > 1; gray dotted lines) across both comparisons in WT BMDMs. Magenta points represent genes significantly DE directly comparing the infection conditions (live H37Rv infected – HK H37Rv infected).
(B) As in (A), except showing the 1,712 genes DE across the same comparisons in IFNAR KO BMDMs. See also Figure S2.
(C) Principal-component analysis of WT or IFNAR KO BMDMs at 24 h post-infection with live H37Rv or HK H37Rv at an 10 of MOI. WT BMDMs were either left untreated or treated with 500 U/mL IFNβ. The percent of variance explained by the top two principal components is indicated.
(D) Heatmap showing the cluster number (left) and log2FC of the 6,337 genes differentially expressed in any of the six comparisons in WT BMDMs.
(E) The 1,411 genes from cluster 4 were tested for enrichment in the Hallmark gene sets from MSigDB (Liberzon et al., 2015; Subramanian et al., 2005) using a hypergeometric test for overlap. The 10 gene sets with the smallest FDR are shown.

