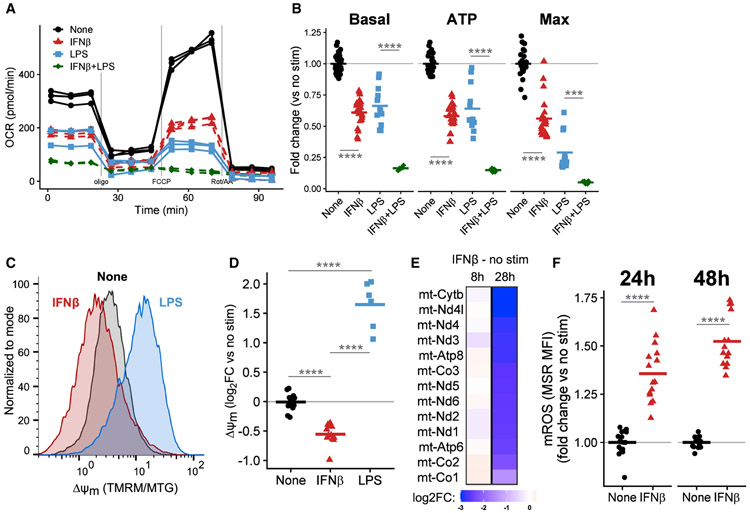
Figure 4. IFNβ impairs mitochondrial function and induces mitochondrial stress in BMDMs.
(A) OCR of WT BMDMs untreated or treated with 500 U/mL IFNβ, 10 ng/mL LPS, or both for 24 h. A single representative plate is shown.
(B) Quantification of mitochondrial parameters derived from (A). Each dot represents a single well and the bar is the mean from four (LPS conditions), six (IFNβ), or three (both) independent experiments. See also Figure S4.
(C) Δψm was calculated by normalizing TMRM to MitoTracker Green (MTG) fluorescence measured by flow cytometry. Representative histograms of BMDMs untreated or treated with 500 U/mL IFNβ or 10 ng/mL LPS for 48 h.
(D) Quantification of Δψm derived from (C). The TMRM/MTG ratio was normalized to the mean of uninfected wells. Each point is a single well and the bar is the mean from three experiments.
(E) Log2FC in expression (RNA-seq) of the 13 protein coding genes encoded on mtDNA in WT BMDMs treated with 500 U/mL IFNβ compared to untreated cells for the indicated time.
(F) Quantification of mROS in WT BMDMs untreated or treated with 500 U/mL IFNβ for indicated times. mROS were measured with MSR MFI normalized to untreated controls at each time point. Each point represents a single well and the bar is the mean from five independent experiments.

