Figure 6.

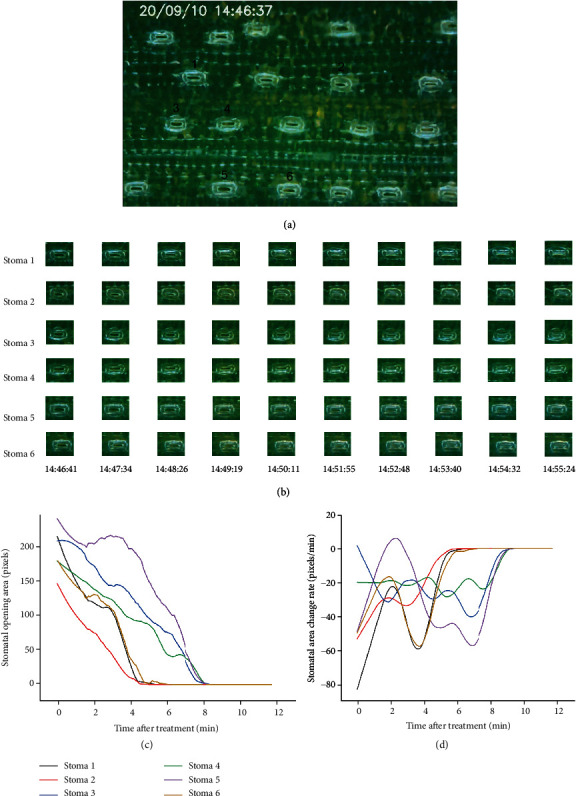
The dynamic changes of stomata under chilling stress. (a) The spatial distribution of stomata. (b) The result of object tracking. (c) The curve of SOA overtime. (d) The curve of stomatal area change rate.

The dynamic changes of stomata under chilling stress. (a) The spatial distribution of stomata. (b) The result of object tracking. (c) The curve of SOA overtime. (d) The curve of stomatal area change rate.