Figure 7.

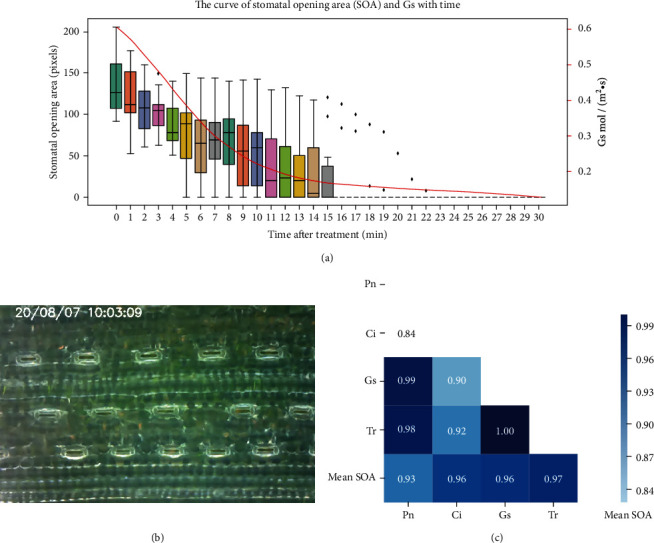
The correlation between SOA and gas exchange. (a) The curve of stomatal opening area (SOA) and Gs with time. (b) The spatial distribution of stomata. (c) The correlation heat map between mean SOA and Pn, Ci, Gs, and Tr.

The correlation between SOA and gas exchange. (a) The curve of stomatal opening area (SOA) and Gs with time. (b) The spatial distribution of stomata. (c) The correlation heat map between mean SOA and Pn, Ci, Gs, and Tr.