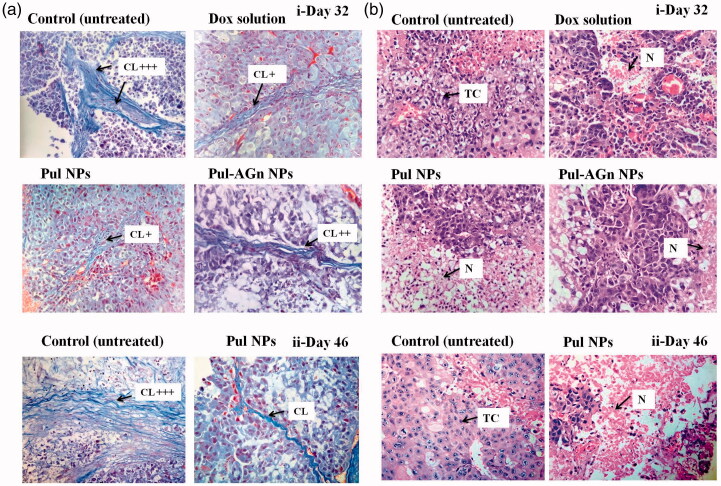
Figure 4.
(a) Tumor sections were stained with Masson’s trichrome on day 32(i) and day 46 (ii) post first dose – the blue color represents collagen content. Original magnifications 400×. The collagen content was quantified using ImageJ and normalized to control (CL – collagen), (b) Images of H&E-stained tumor, sections excised from liver tumor-bearing mice following treatment with Dox formulations on day 32 (i) and day 46 (ii) post first dose. Original magnifications 400 × (TC – tumor cells with large prominent nuclei; N – necrotic cell mass).

