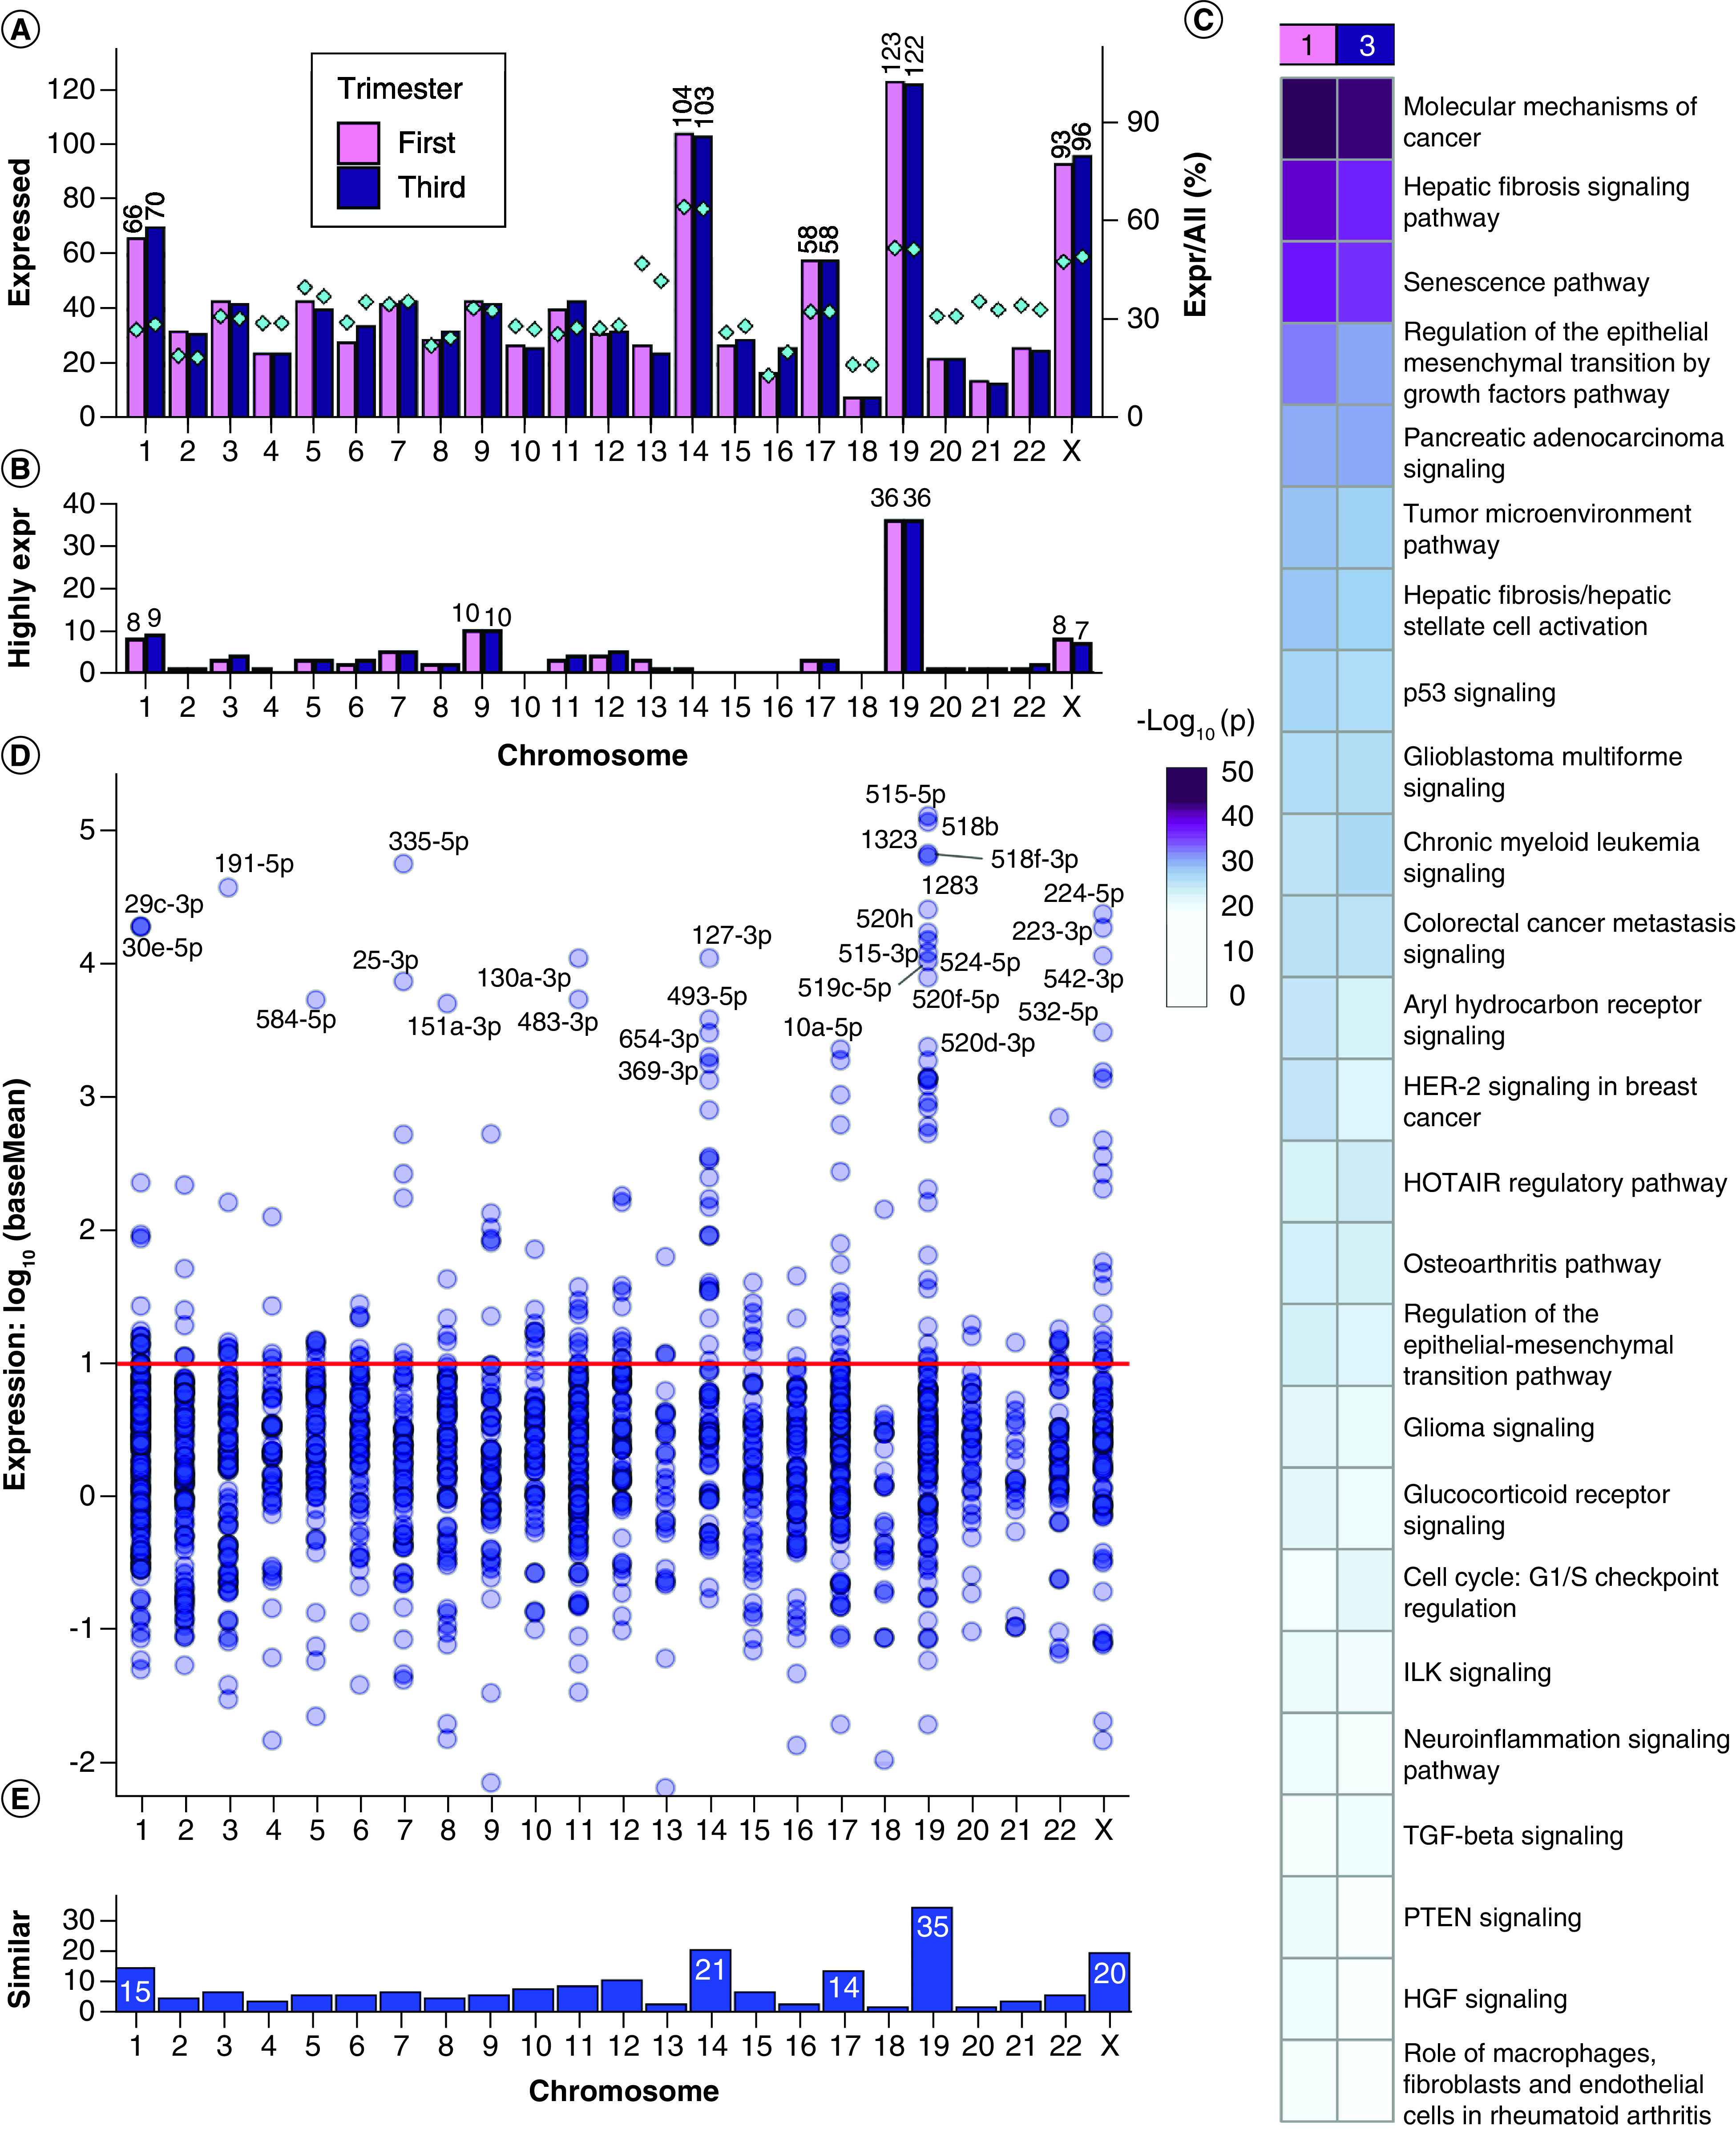
Figure 1. . Expressed miRNAs in first and third trimester placenta.

(A) Chromosome distribution of precursor miRNAs expressed at baseMean >10 in first or third trimester placenta. Barplot: frequency per chromosome. Diamond points and right y-axis: percentage of placenta-expressed miRNAs per total chromosome miRNAs. (B) Distribution of the most highly expressed precursor miRNAs at baseMean >10,000. (C) Pathway enrichment analysis with experimentally confirmed target genes of the most highly expressed miRNAs. (D) The expression distribution of miRNAs similarly expressed in first and third trimester at p ≥ 0.05 and fold change ≤2. The red line (baseMean = 10) is the threshold selected for stable expression. (E) Counts of similarly expressed miRNAs with p ≥ 0.05, fold change ≤2 and baseMean >10 in both trimesters.
