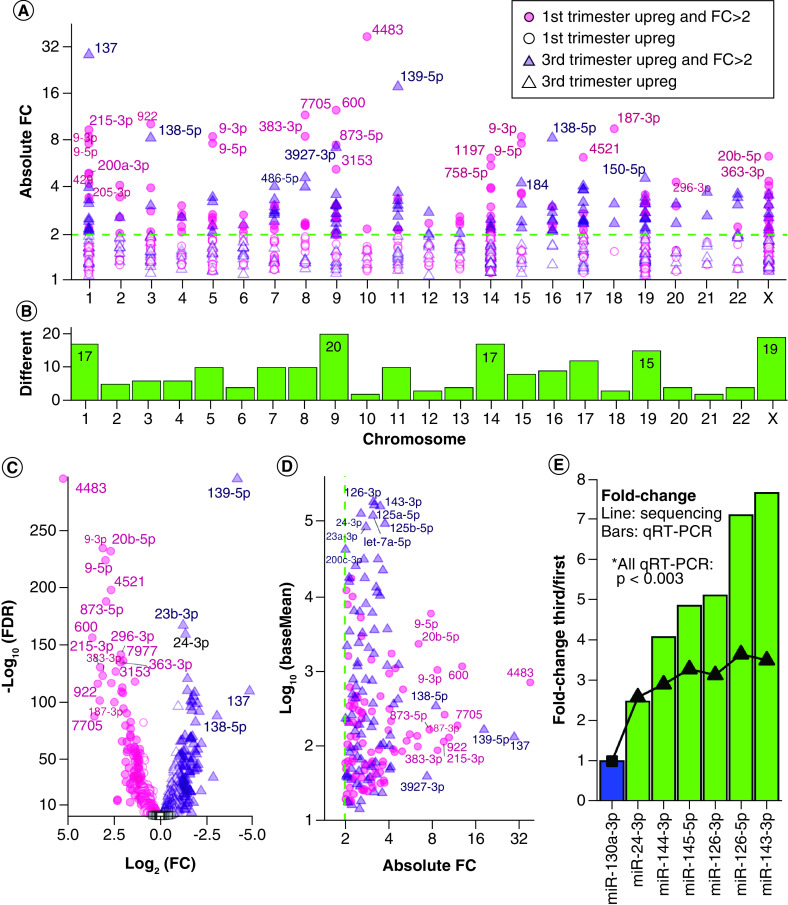
Figure 2. . Differentially expressed miRNAs between first and third trimester placenta.
(A) Scatter plot of absolute fold change distribution across chromosomes for all DE miRNAs at FDR <0.05 and baseMean >10. The dotted line represents FC = 2. (B) Chromosome frequency of 180 DE miRNA precursors at FDR <0.05, FC >2, baseMean >10. (C) Volcano plot of all miRNAs with baseMean >10. Key as in (A), with addition of open black squares for nonsignificant miRNAs (FDR ≥0.05). (D) Expression versus absolute fold change for 180 DE miRNAs. (E) Six DE miRNAs (green) were selected for validation via quantitative real-time-PCR in an independent cohort. The bar plot shows qRT-PCR results normalized to an internal reference, hsa-miR-130a-3p (blue). The superimposed line shows fold changes in miRNA-seq. All six miRNAs were validated significantly different between first and third trimester with p < 0.003.
DE: Differentially expressed; FC: Fold change; FDR: False discovery rate.

