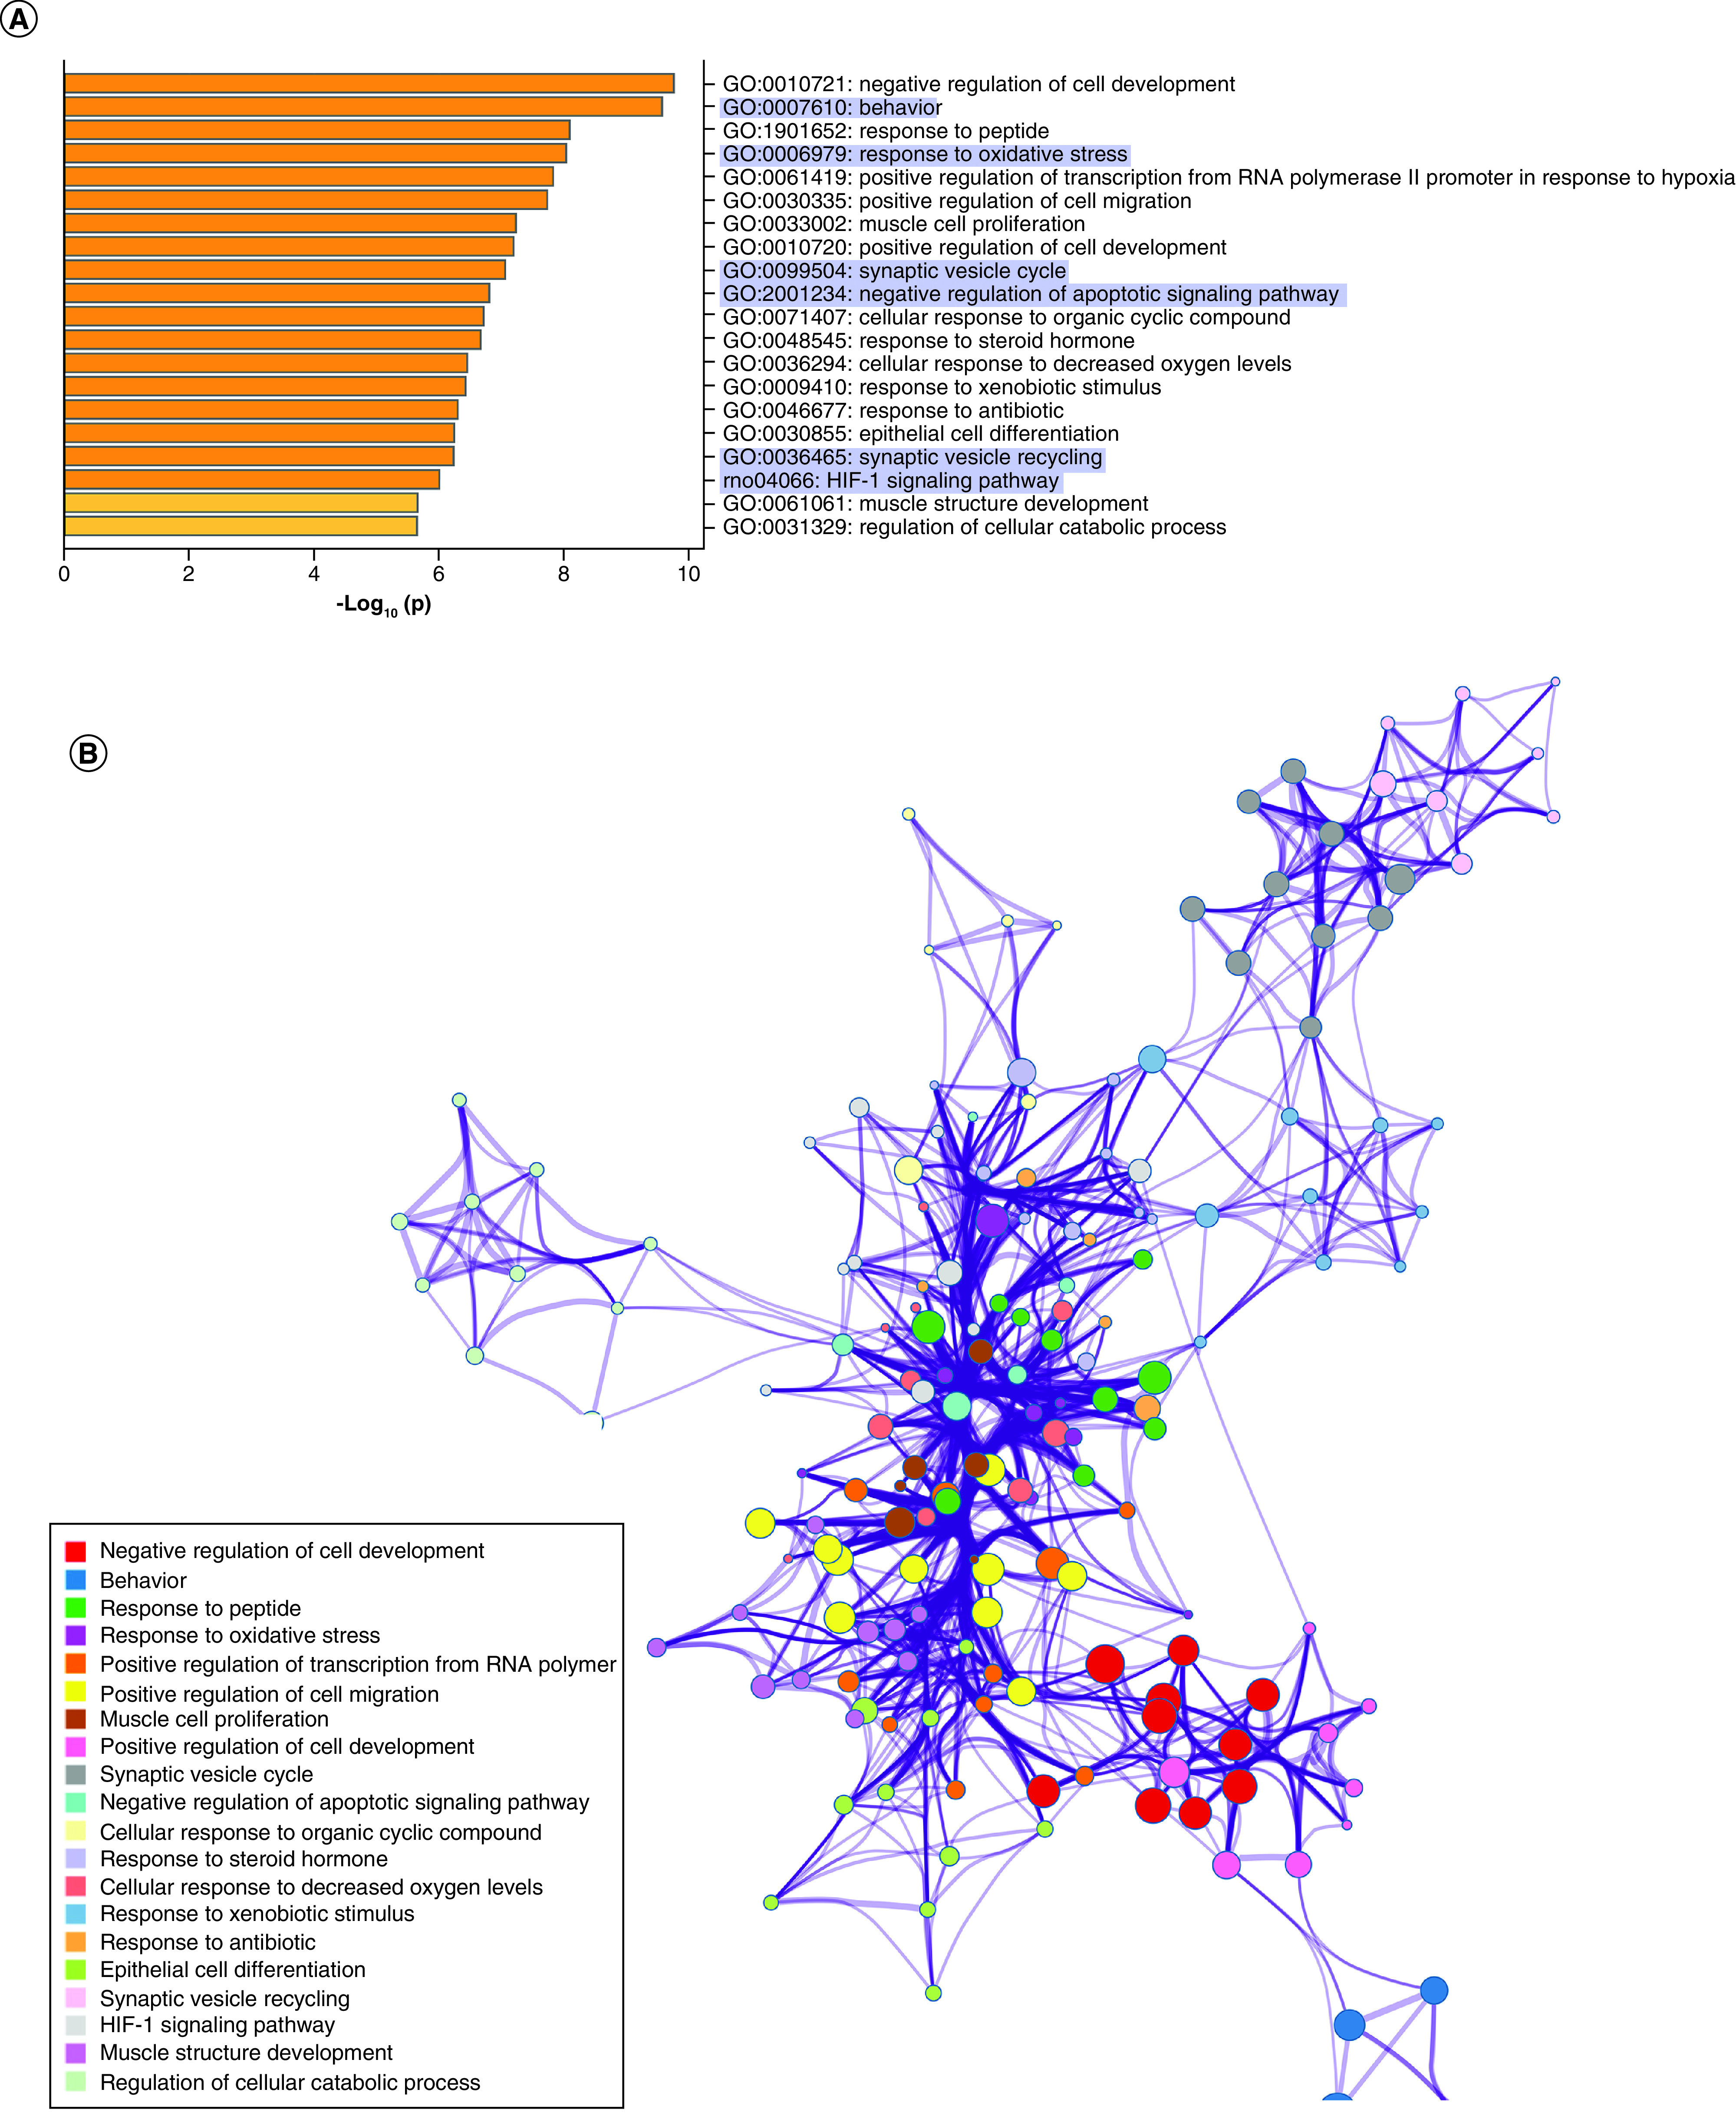
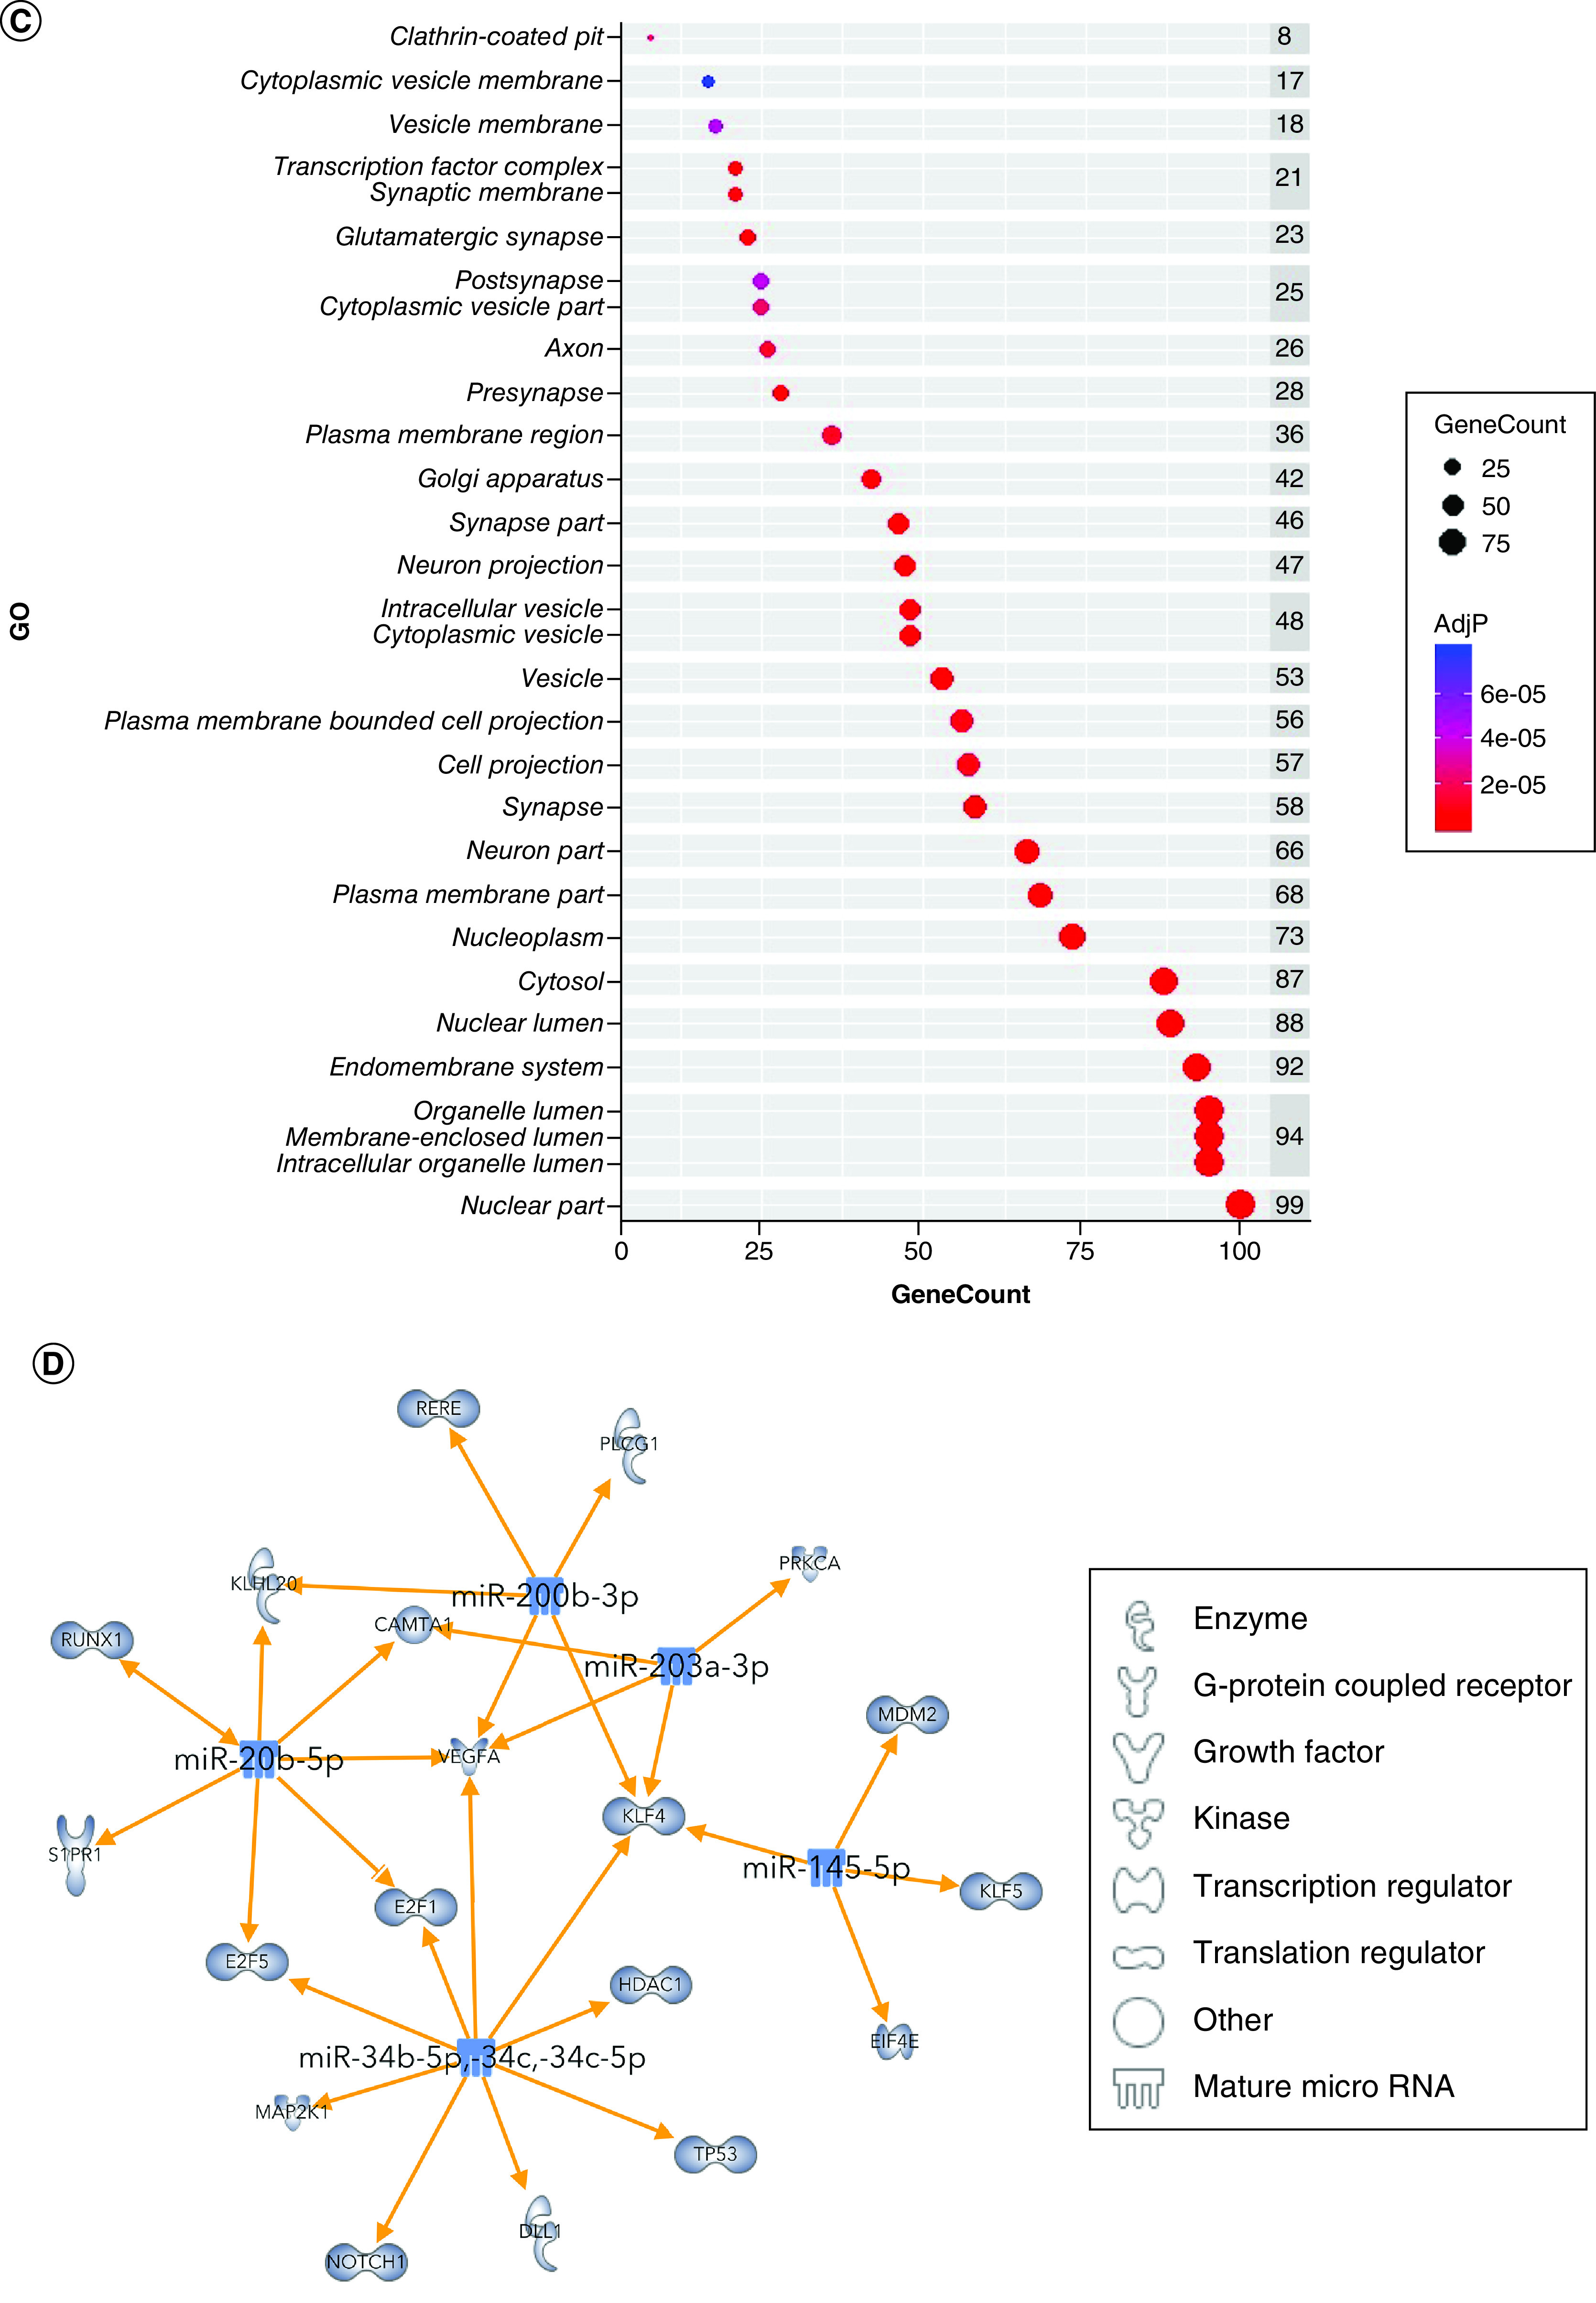
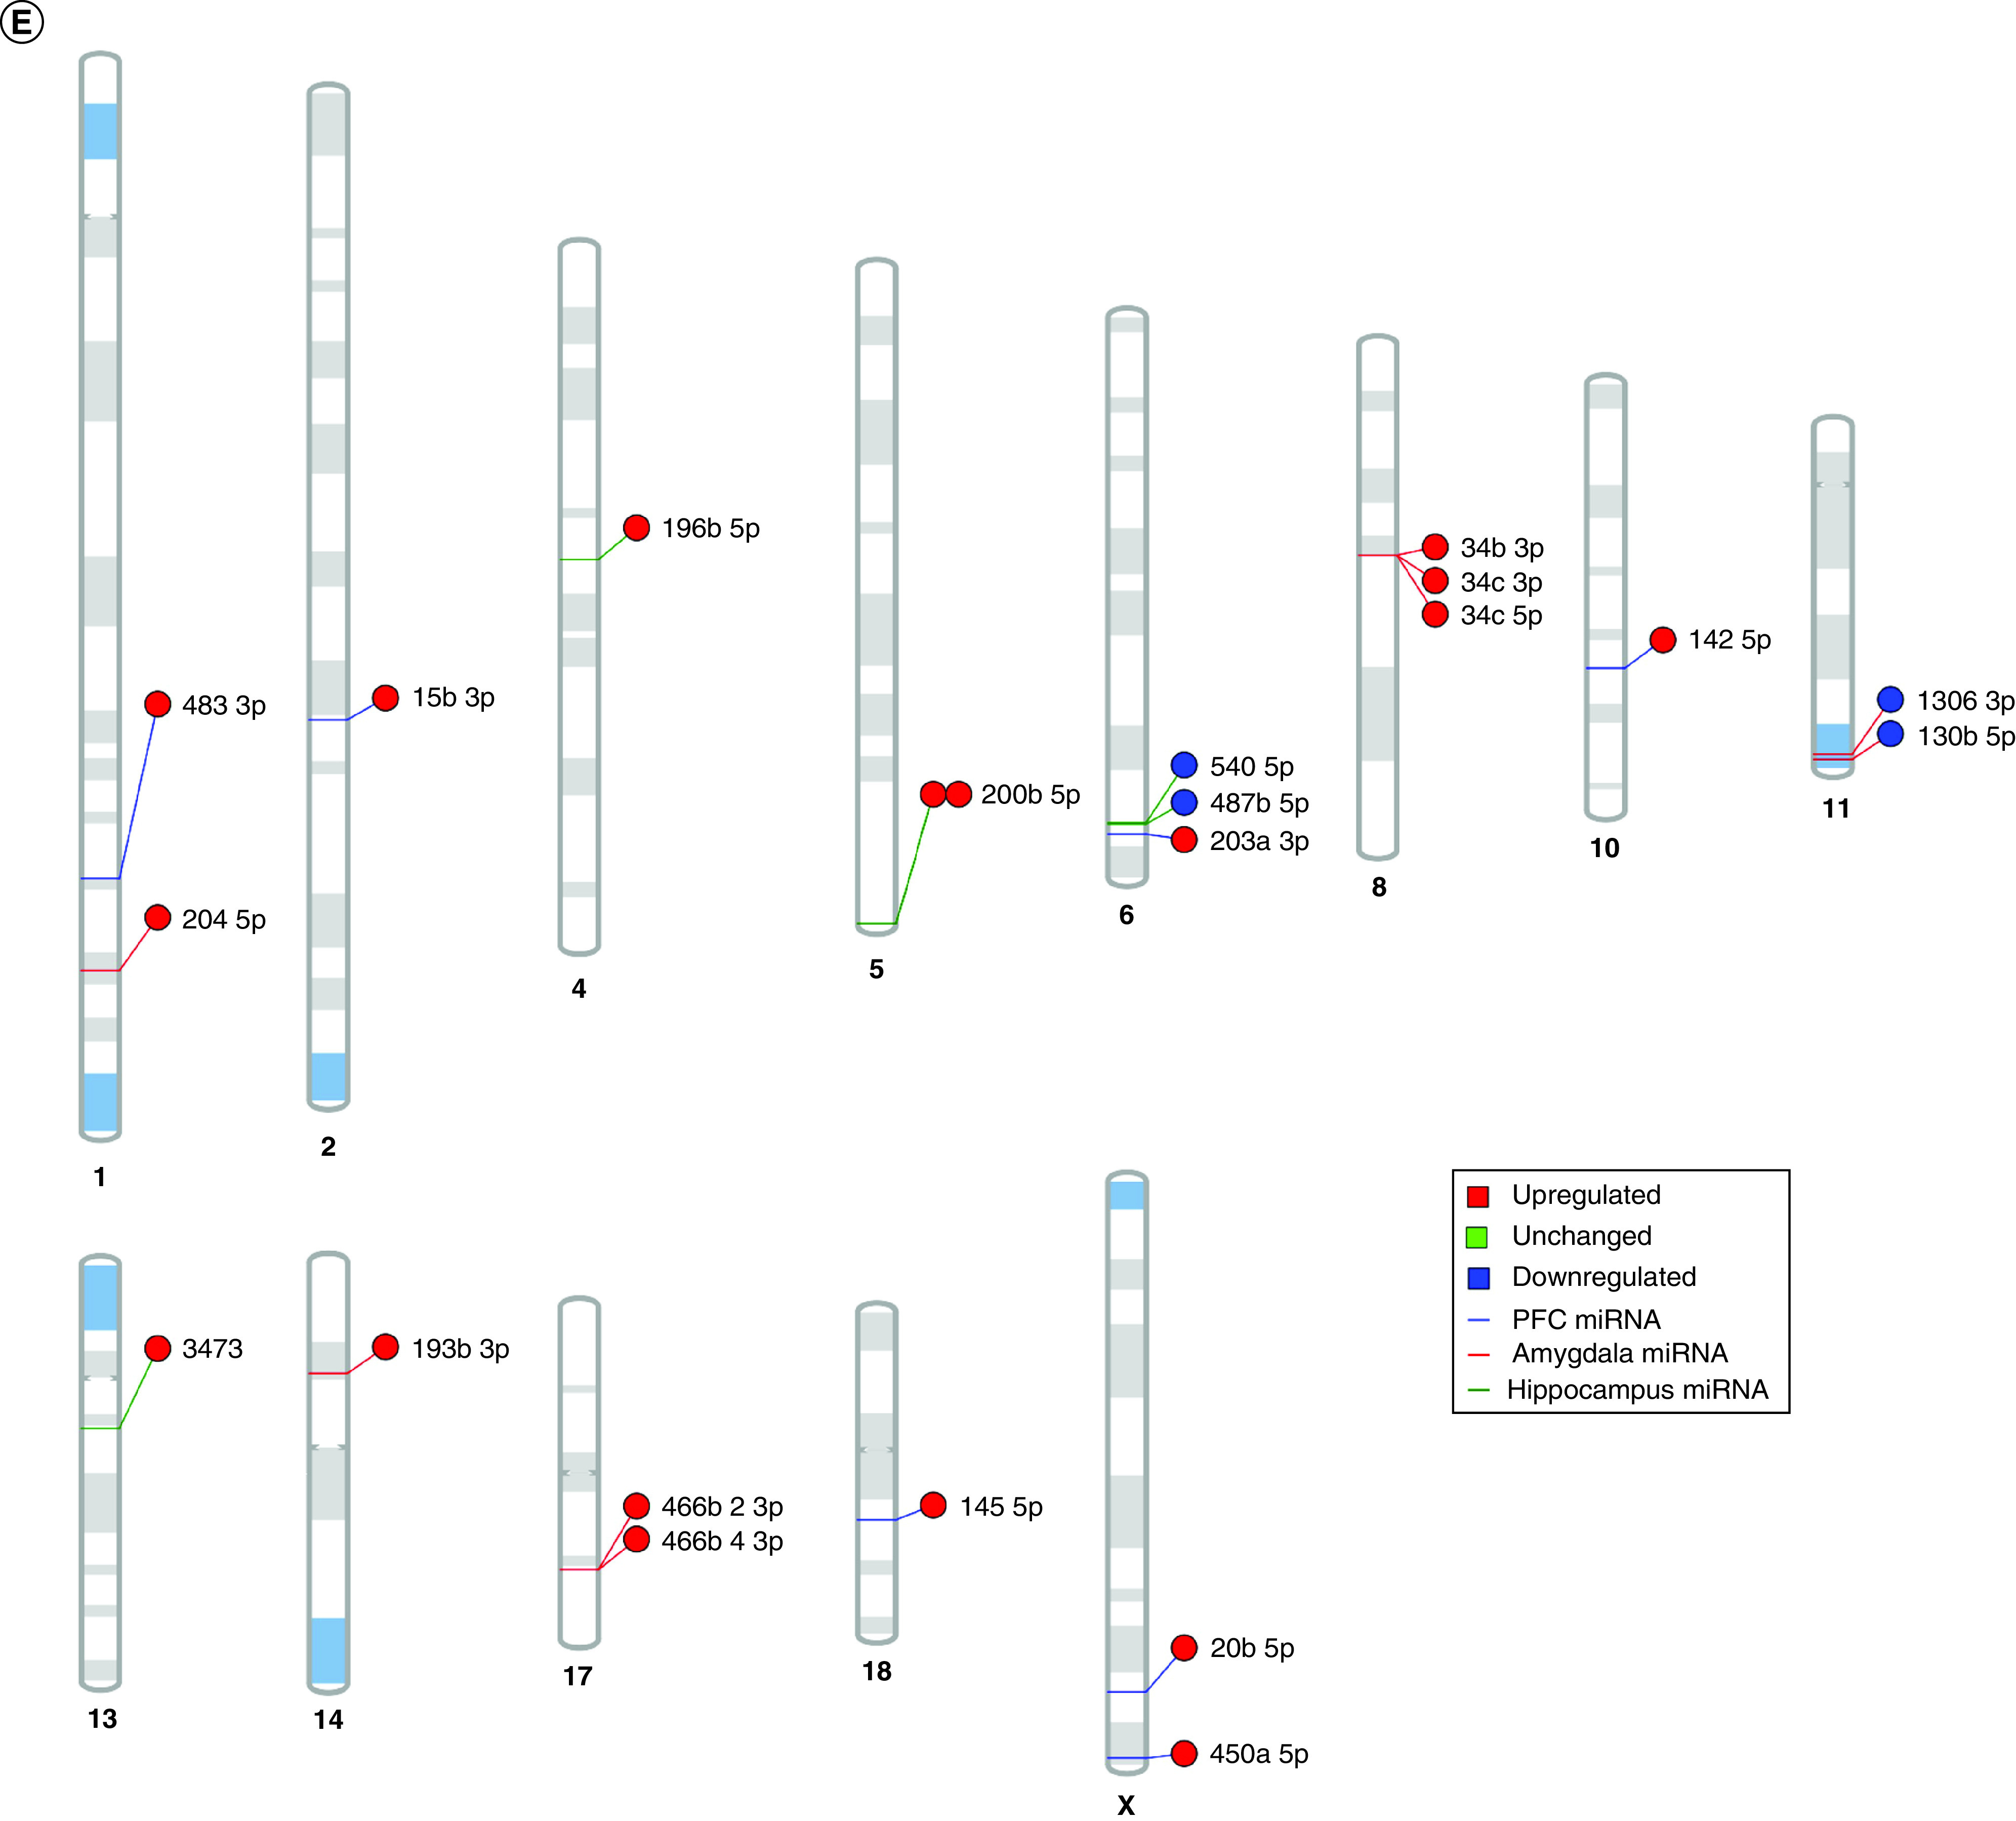
Figure 4. . Maternal separation bioinformatic gene ontology analysis, miRNA–gene target maps and miRNA chromosomal localization.


(A) We tested biological function GO based on predicted gene targets which have been reported in psychiatric disorders in ingenuity path analysis software. The top 20 ontologies are shown as a bar plot; those particularly relevant to stress and depression have been highlighted in blue. (B) The same ontologies plotted as a network, with each node color-coded based on its membership in one of the top 20 ontologies; the size of each node corresponds to its significance, with larger nodes being more significant. (C) Bubble plot of the top 30 most significant cellular compartment GO terms (false discovery rate <0.05; shown by bubble color). Bubble size corresponds to the number of gene targets within each ontology. (D) Using ingenuity path analysis, we created miRNA–gene target networks based on miRNAs significantly affected by maternal separation and their predicted targets. (E) miRNAs were mapped to the rat genome using a phenogram. Counts per million fold change direction is noted by color based on the figure legend. Line color indicates the brain regions where significant group differences were detected.
GO: Gene ontology; PFC: Prefrontal cortex.
