Figure 4.

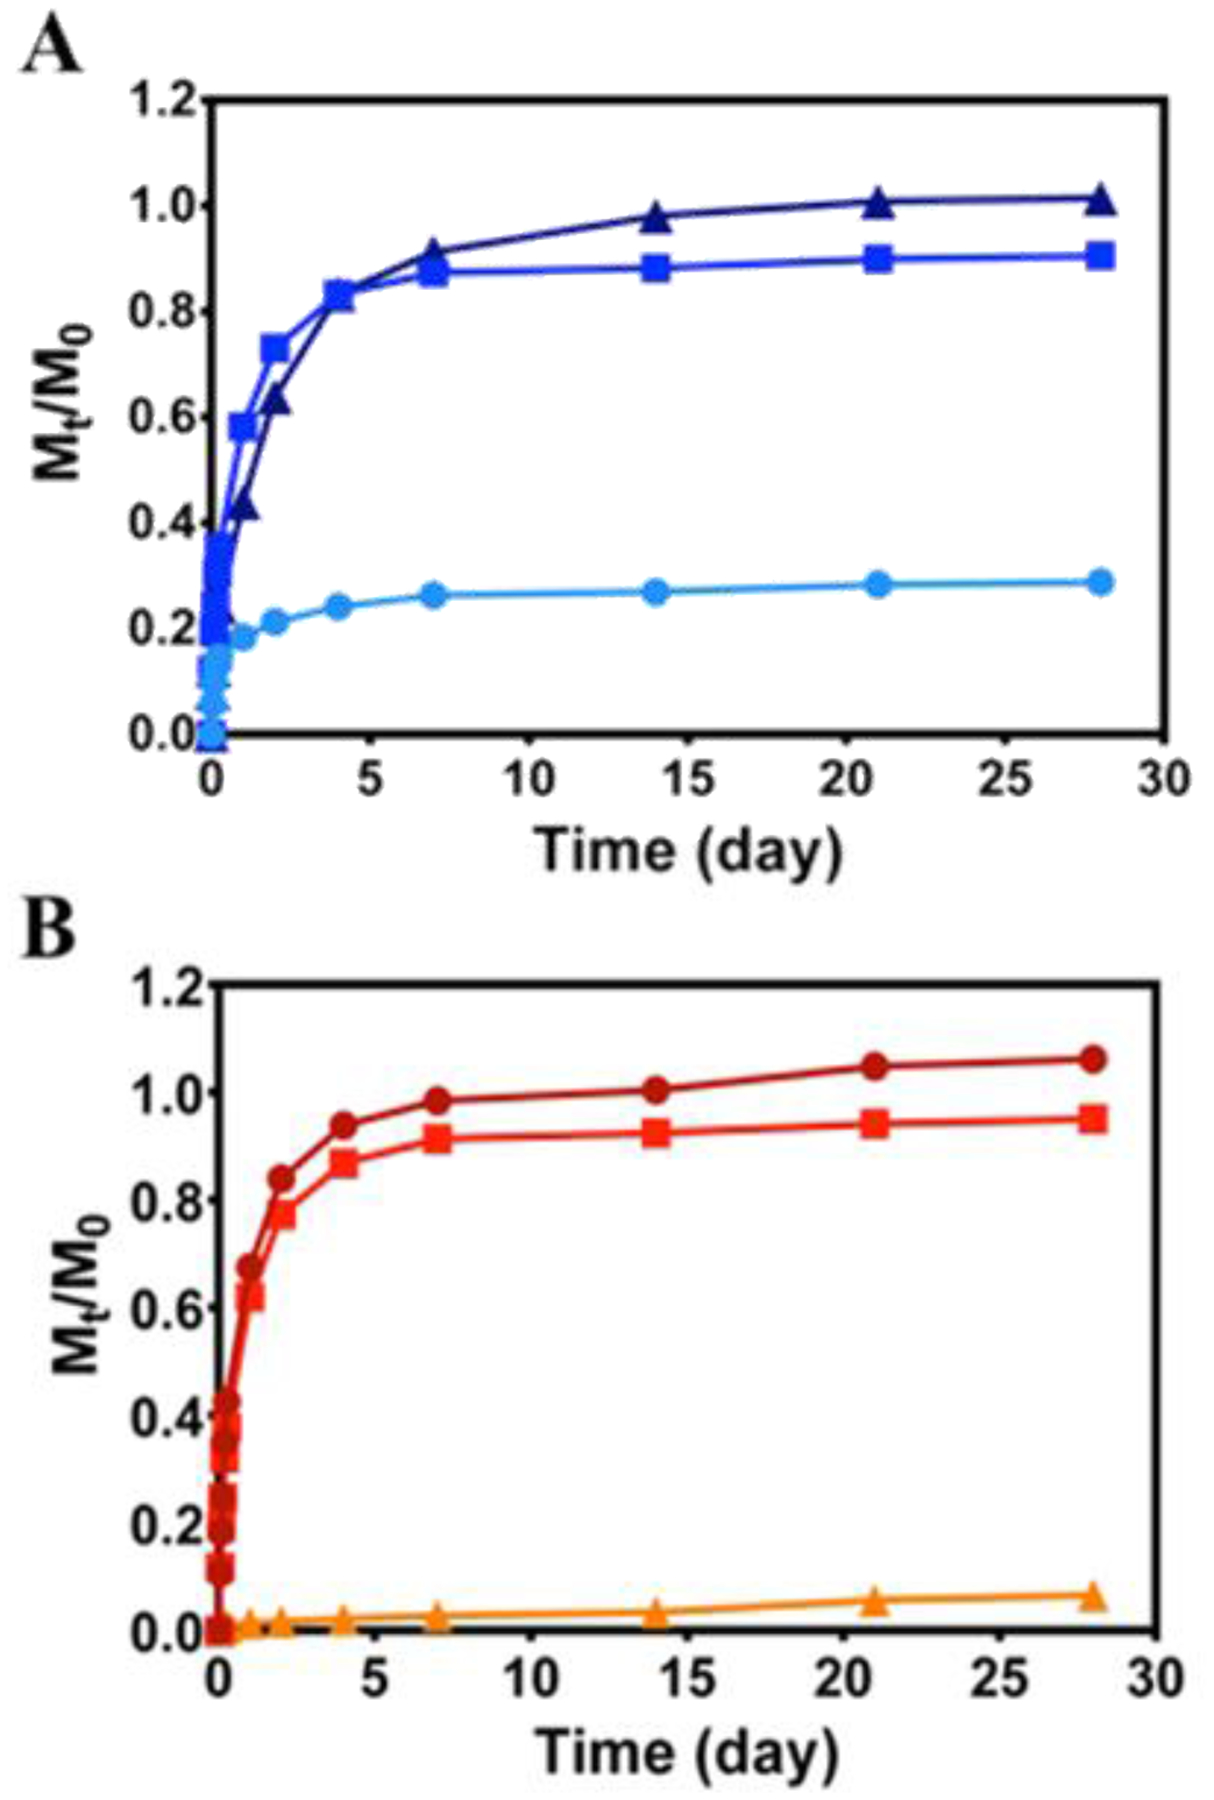
Cumulative release profiles of α-lactalbumin (●), myoglobin (■), and lactoferrin (▲) from 0.5 wt % HLT2 (A) and VEQ3 (B) hydrogels. Error bars are smaller than symbol where not evident. Lines are included to guide the eye.

Cumulative release profiles of α-lactalbumin (●), myoglobin (■), and lactoferrin (▲) from 0.5 wt % HLT2 (A) and VEQ3 (B) hydrogels. Error bars are smaller than symbol where not evident. Lines are included to guide the eye.