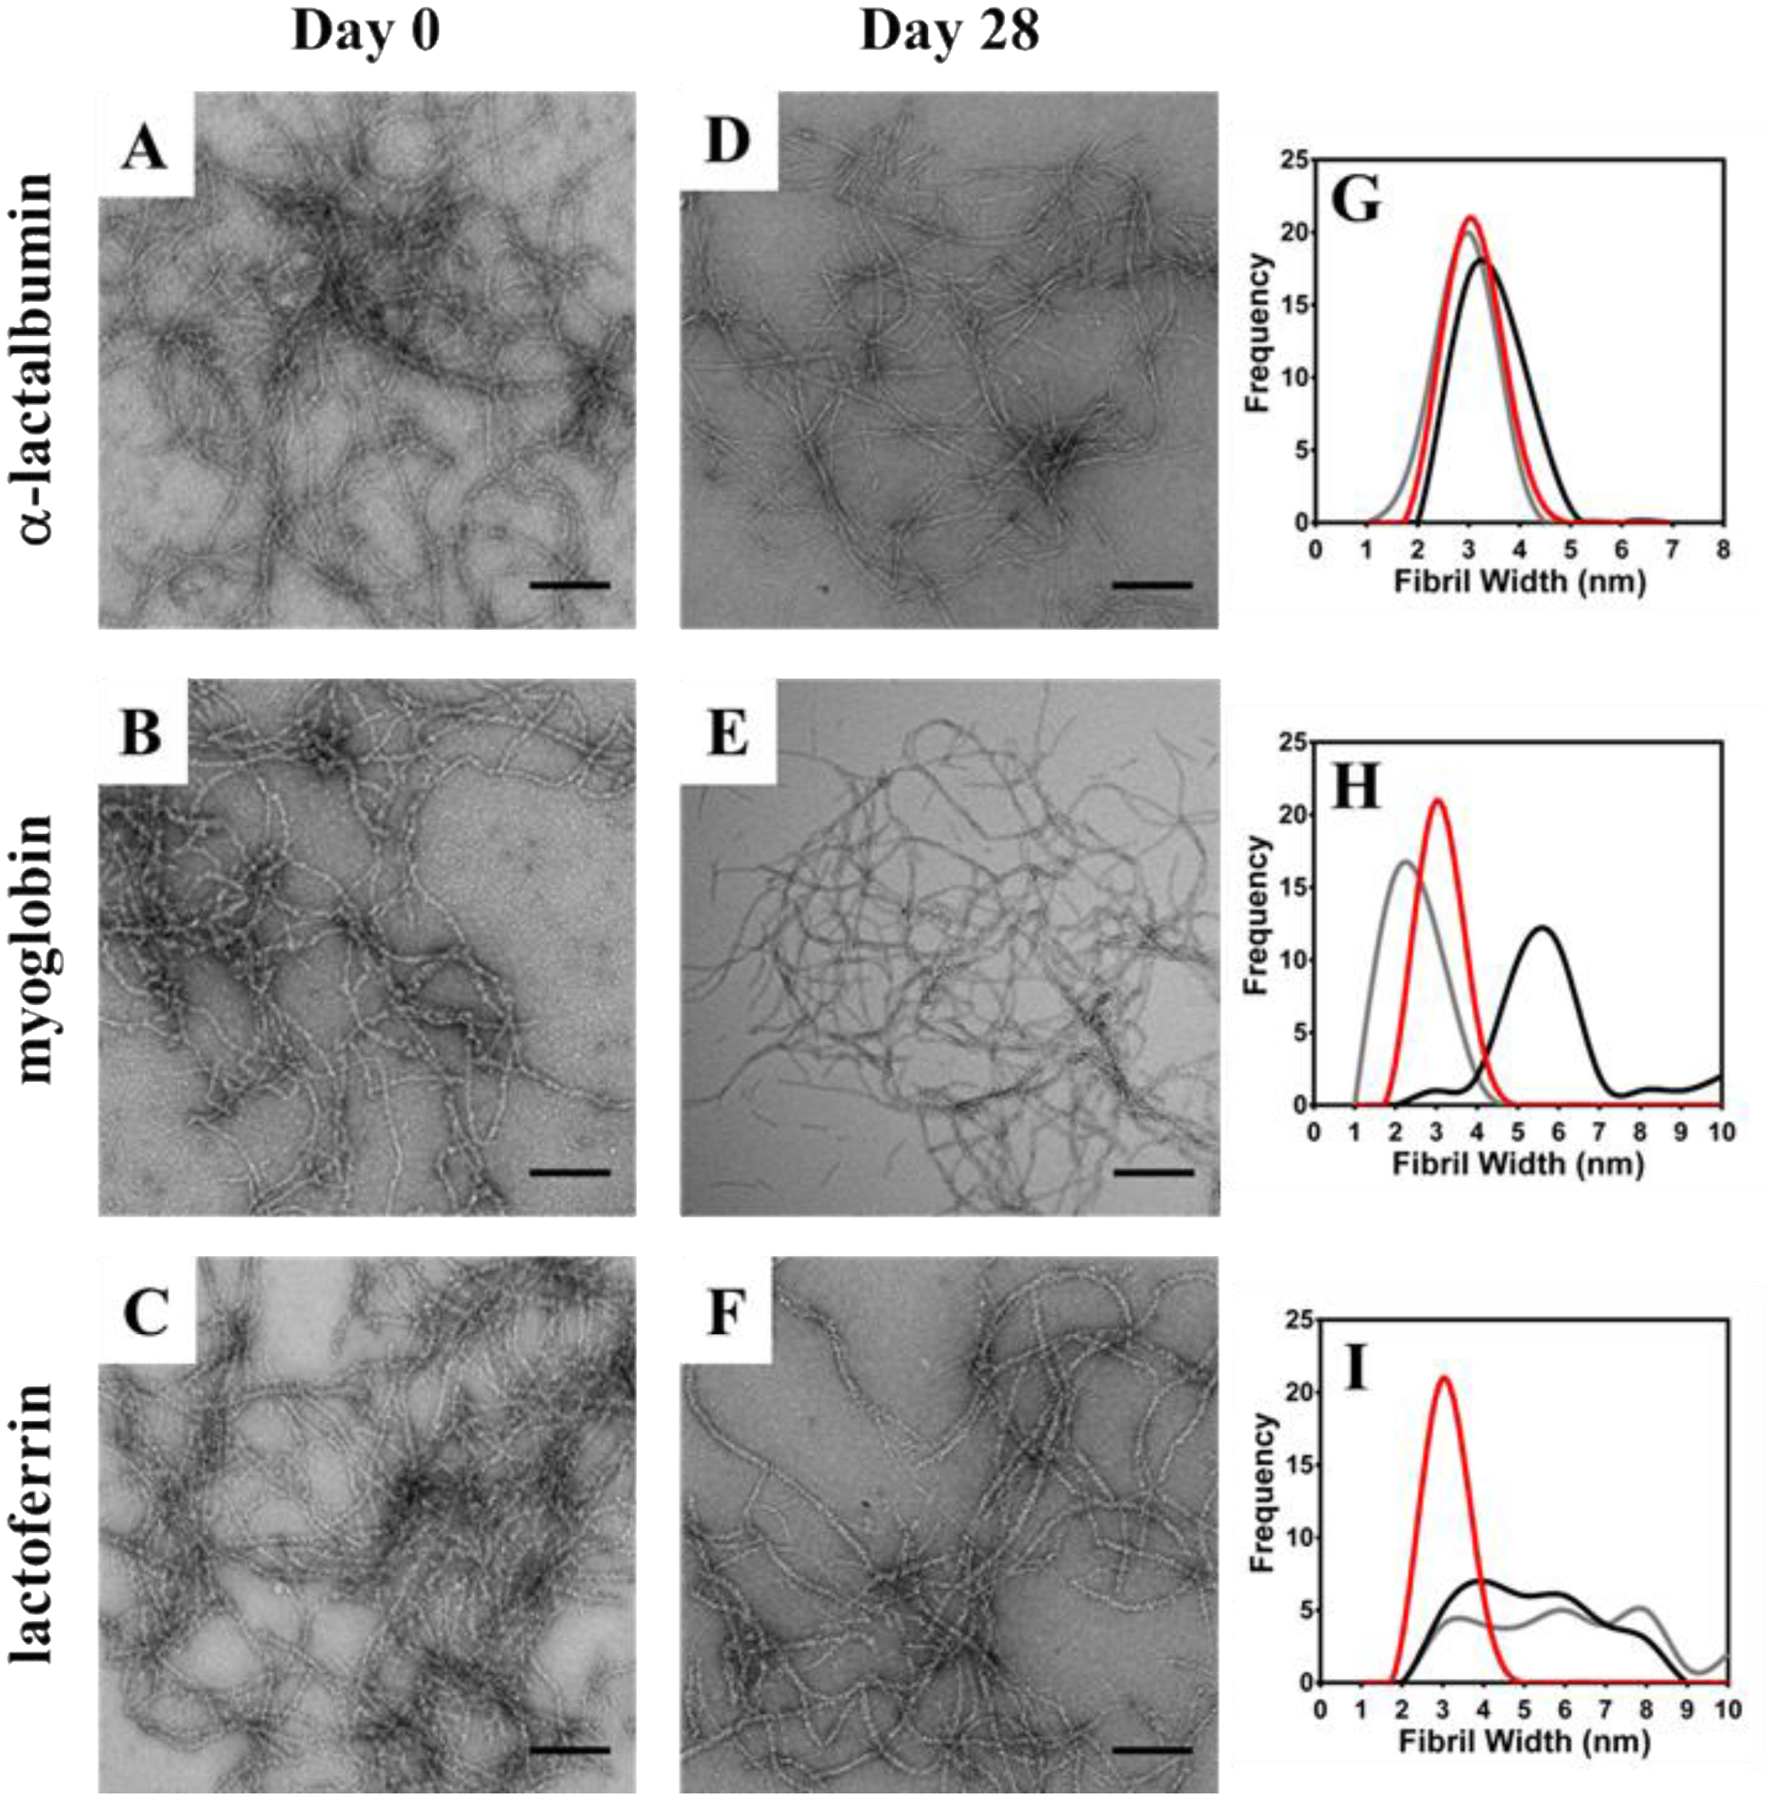
Figure 6.

TEM micrographs of α-lactalbumin (A&D) myoglobin (B&E) and lactoferrin (C&F) interaction with fibrils at 0 (A-C) and 28 (D-F) days after encapsulation in 0.5 wt % VEQ3 hydrogels. Measured fibril widths provide a direct indication of protein-fibril interactions (G-I) by comparing fibrils in the absence of protein (red) with samples from day 0 (black) and day 28 (gray) after protein release. Scale bar = 200 nm.
