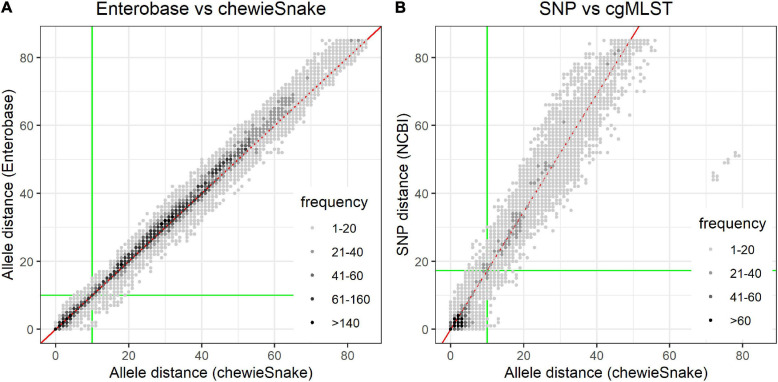
FIGURE 3.
Pairwise distances show very high method congruence. (A) Comparison of allele distance between Enterobase and chewieSnake. (B) Comparison of NCBI_pathogen SNP and chewieSnake allele distance. The gray shading indicates the frequency of observed pairwise distances. Both figures show the very high concordance between the different methods. This is also reflected in the Spearman correlation coefficients (0.984 and 0.973). The slope of a linear fit (red line) to the NCBI_SNP and chewieSnake comparison is ∼1.73; i.e., on average, 1 allele difference corresponds to 1.73 single-nucleotide polymorphisms. For the computation of sensitivity and specificity, the green lines mark clustering thresholds. All points in the lower left quadrant are counted as true positives, and all points in the upper right quadrant as true negatives, whereas the points in the top left and bottom right quadrants are false positives and false negatives, respectively. Using these thresholds also leads to the high adjusted Wallace and adjusted Rand coefficients (see Tables 1, 2). Though overall the agreement is very high, some remaining differences at low distances may still influence interpretation of the very fine-grained phylogeny. Note that for the Enterobase comparison, only distances below 85 AD were displayed.

