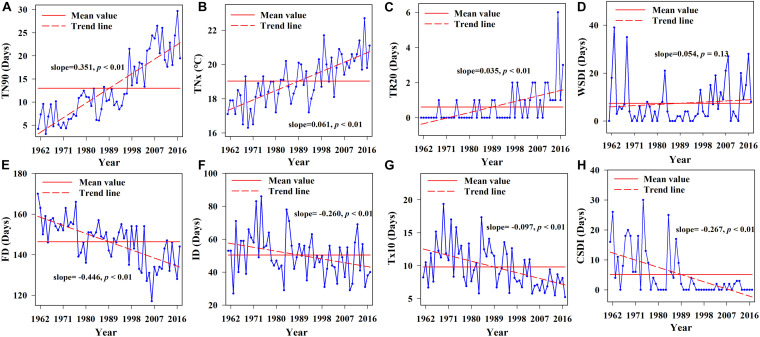
FIGURE 4.
Linear trend charts of annual extreme temperature indices during 1961–2017. (A) linear trend chart of warm nights, (B) linear trend chart of monthly maximum value of min temperature, (C) linear trend chart of hot nights, (D) linear trend chart of warm spell duration indicator, (E) linear trend chart of frost days, (F) linear trend chart of icing days, (G) linear trend chart of cold days, and (H) linear trend chart of Cold spell duration indicator.

