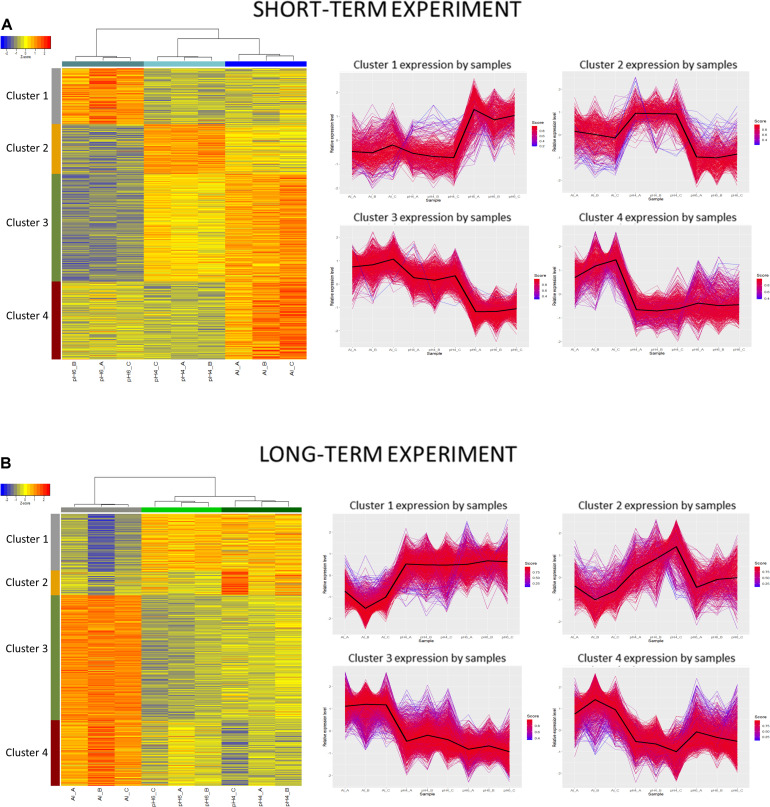
FIGURE 14.
Clustering analysis using hierarchical clustering of samples and k-means clustering of genes. Clustering was performed using a selected set of genes differentially expressed in barley root meristems grown at pH = 4.0 compared to pH = 6.0 and treated with 10 μM of bioavailable Al3+ compared to pH = 4.0. Gene counts were regularized log (rlog) transformed with library size-wise normalization, scaled and centered to be represented as z-scores in the log2 scale. Hierarchical clustering of samples was performed using distance based on Pearson’s correlation coefficient with Ward D2 linkage algorithm. Heat-map represent their expressional patterns. Color bars on the left are corresponding to each consequent cluster identified: from 1 on the top to the 4 at the bottom. For each gene cluster detected with k-means clustering, a plot of relative gene expression profile is shown on the right with black lines indicating each cluster centroids. Scores represent correlations of each gene with the cluster core. (A) Short-term experiment; (B) long-term experiment.

