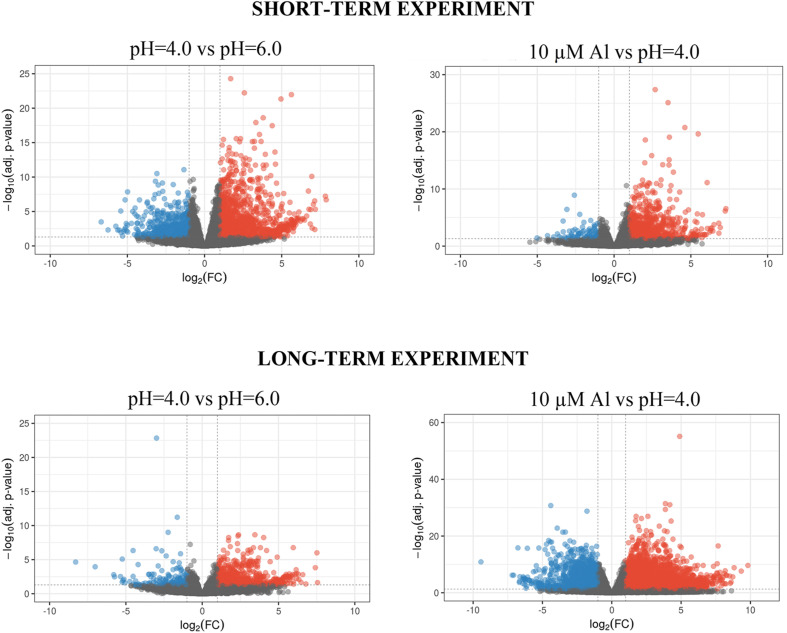
FIGURE 4.
Volcano plots of differential expression analysis of barley root meristems grown at pH = 4.0 compared to pH = 6.0 and treated with 10 μM of bioavailable Al3+ compared to pH = 4.0 in the short-term and long-term experiments. Each dot represents one gene. Dashed lines determine cut-off of | log2FC| ≥ 1 and FDR adjusted P-value ≤ 0.05. Blue dots correspond to gene expression down-regulation, whereas red dots – up-regulation.

