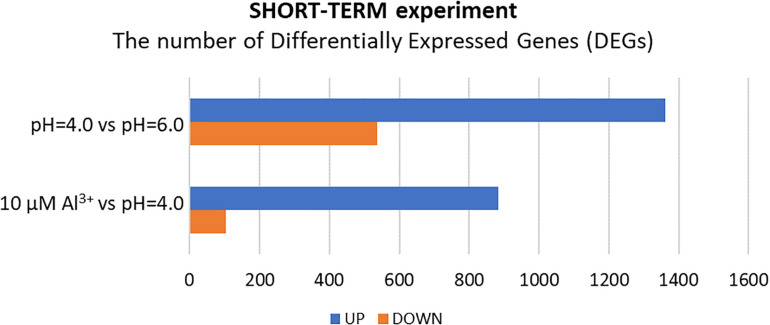
FIGURE 5.
The number of differentially expressed genes (DEGs) in the transcriptome of barley root meristems in the short-term experiment. DEGs were determined for plants grown at pH = 4.0 compared to pH = 6.0; and after 24 h treatment with 10 μM Al at pH = 4.0 compared to pH = 4.0 without Al3+ ions (DEGs were identified under α = 0.05 with FDR adjusted P-value and log2FC ≥ 1 or ≤–1).

