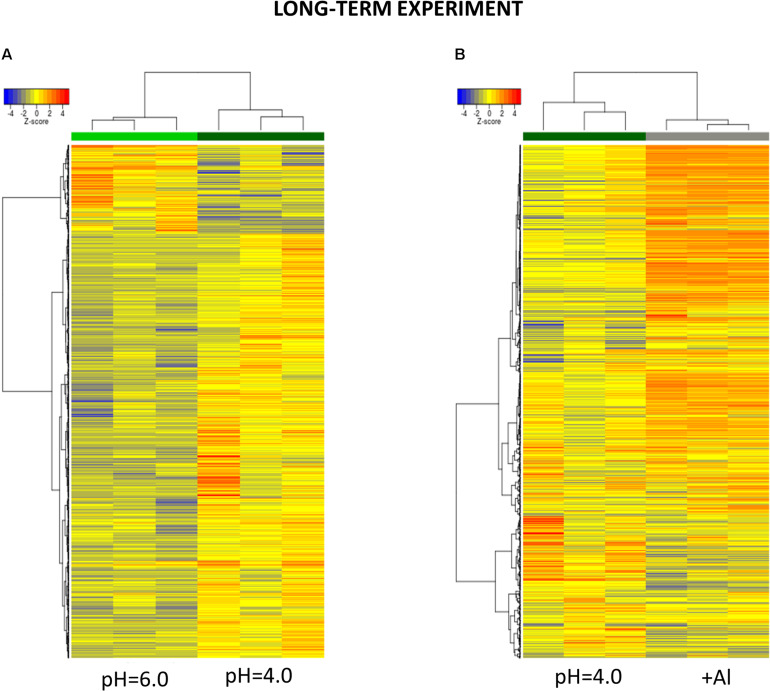
FIGURE 9.
Hierarchical clustering of samples using distance based on Pearson’s correlation coefficient with Ward D2 linkage algorithm for a set of genes differentially expressed in barley root meristems in the long-term experiment. Gene counts were regularized log (rlog) transformed with library size-wise normalization, scaled and centered to be represented as z-scores in the log2 scale. The heat map represents the relative expression levels of DEGs. (A) The comparison between pH = 4.0 and pH = 6.0. (B) The comparison between Al-treatment at pH = 4.0 and pH = 4.0 without Al.

